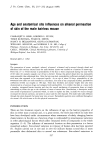
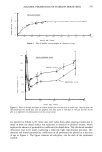
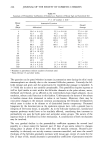
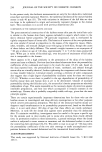
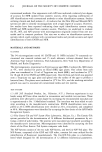
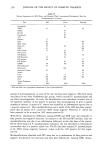
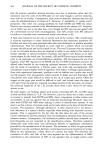
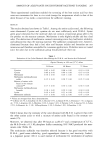
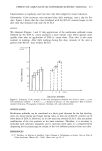
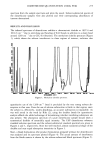
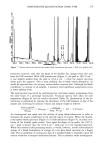
ALKANOL PERMEATION OF HAIRLESS MOUSE SKIN 247 6 water 8[ methanol 40 [ butanol 20 10 i i i i i i 100 hexanol 60 40 ß 20 i I i i i i i i i 160 [ octanol ß 40 i i i i i i i i • i 40 80 120 160 200 240 280 320 360 MOUSE AGE (days) _ Figure 3. Plots of permeability coefficients (P-values) of the abdominal and the dorsal skins of hairless mouse as a function of age. Data are graphed for water (plot 3-a), methanol (plot 3-b), ethanol (plot 3- c), butanol (plot 3-d), hexanol (plot 3-e), and octanol (plot 3-f). The closed triangles, •, are data from dorsal skin sections while the closed circles, O, are data obtained with abdominal sections. to mass transfer across strata beneath the horny tissue, as observed with octanol, are to be expected. While the membrane as prepared is thus behaving predictably on this score, this influence of skin thickening on hydrophobic permeants would either not exist or would not be anywhere near as exaggerated in the living animal where per- meation presumably terminates at the interface of the systemic blood in the upper reaches of the dermis. In all young animals the ratio of the body surface area to the body weight gradually

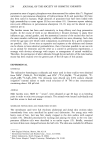
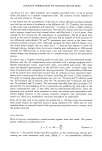
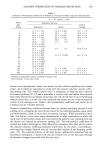
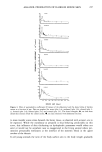
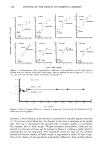
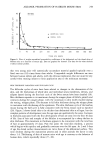
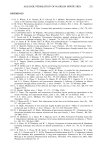
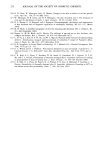
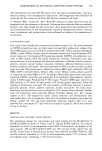
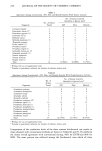
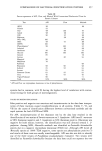
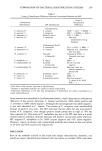
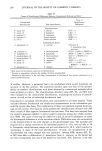
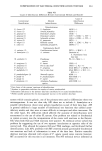
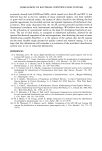
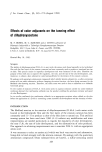
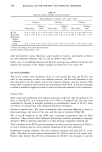
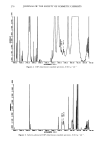
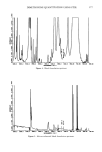
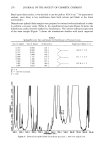
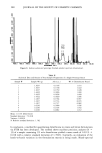
248 JOURNAL OF THE SOCIETY OF COSMETIC CHEMISTS lOO 50 lOO 50 4 days dorsal • ß ,., ß ,.--abdominal ,, -water •-water 2 4 6 8 53 days dorsal 5/ ,,.• bdomina / e.- ..•" ß • • water i i i i 2 4 6 8 lOO 5o lOO 5o 5 days dorsal • •' '•- abdominal ,, ß ß ß water. •-water i i i 2 4 6 8 210 days dorsal •?'.." •/:•-abdominal -• water 2 4 8 8 100 50 lOO 50 20 days .ß..• •oo 50 dorsal '•C'. ' • /: ...,.--abdominal / ß / lo ,. / •water i i i 2 4 6 8 270 days dorsal • '• abdominal / : .,, •---water i i i i , 2 4 6 13 lOO 5o 25 days dorsal "'•ßß ./•' ,• •- abdominal / .. •water i i i 2 4 6 8 360 days dor s al• ,' •. ab d omin a I • w?er i i 2 4 6 ALKYL CHAIN LENGTH Figure 4. Semologarithmic plots of permeability coefficients of the abdominal and the dorsal skins of hairless mice as a function of the alkyl chain length. Data are graphed for mice of ages of 4, 5, 20, 25, 53, 210, 270, and 360 days, shown as sub-plots 4-a through 4-h. 0.6 I HALE MICE 0.4 •.- . DORSAL SKIN ADOME. 0.2 o I I I I i i , I i 0 40 80 120 160 200 240 280 320 360 J 4OO AGE (DAYS) Figure 5. Plot of •r-values (dP/dn) as a function of mouse age. Data for both the abdominal and the dorsal skin sites are graphed. decreases, a factor bearing on the systemic accumulation of topically applied chemicals (1). For an area of prescribed size, the decrease in this ratio is enormous as the animal ages. One way to demonstrate the increased risk to younger animals is to normalize the transport data to body weight. Weight-normalized permeability coefficients are plotted as a function of mouse age for butanol in Figure 6, yielding a profile which is representative for all compounds. The normalized values are large for the newborn animals and decline rapidly till adult weight is approached at about 50 days of age. Even in the absence of real age-related permeability differences, these profiles indicate
Purchased for the exclusive use of nofirst nolast (unknown)
From: SCC Media Library & Resource Center (library.scconline.org)