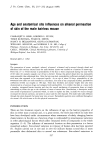
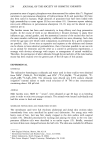
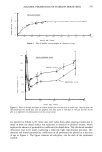
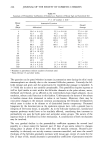
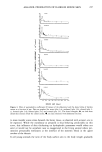
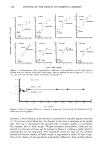
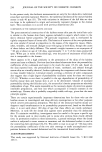
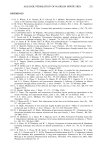
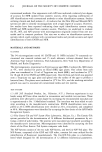
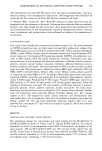
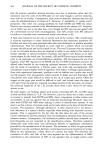
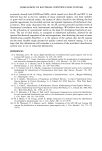
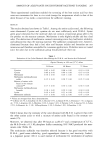
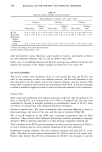
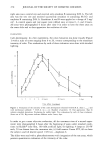
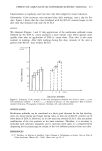
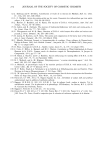
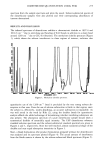
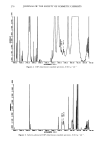
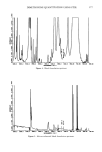
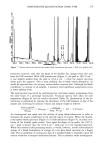
ALKANOL PERMEATION OF HAIRLESS MOUSE SKIN 241 60 4O 2O HAIRLESS MOUSE ß ß '•": - ' I I ! I ! I I 0 40 80 120 160 200 240 9.80 320 MOUSE AGE (DAYS) Figure 1. Plot of hairless mouse weight as a function of age. I I 400 600 MALE HAIRLESS MICE 500 400 % 3oo ,,._., • •ABDOMINAL SKIN • 200 • •oo I I I I o lOO 200 300 I 400 MOUSE A6E (DAYS) Figure 2. Plots of average thickness of hairless mouse skin as a function of mouse age. Data for both the abdominal and the dorsal skin sites are graphed. The data point at 328 days of 318 •m was left off the plot as it appeared non-representative of the overall trend. are reported in Tables I-VI. Some data were taken from other ongoing studies and in many of these the dorsal surface was subjected to chemical or physical trauma, which explains the absence of permeability coefficients for dorsal skins. The calculated standard deviations tend to be small, indicating a relatively high experimental precision. Ab- dominal and dorsal permeability coefficients of all permeants are plotted as a function of age in Figure 3. The figure contains six sub-plots, one for each of the permeants studied.

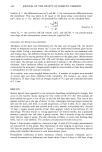
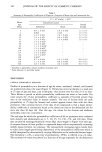
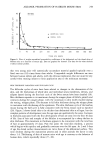
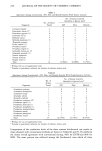
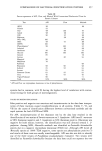
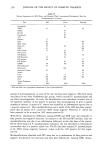
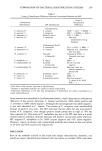
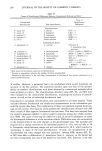
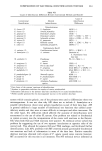
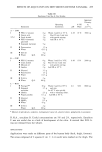
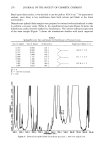
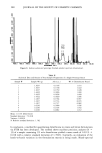
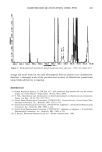
242 JOURNAL OF THE SOCIETY OF COSMETIC CHEMISTS Table I Summary of Permeability Coefficients of Water as a Function of Mouse Age and Anatomical Site P X 10 3 (cm/hr) + S.D. a Mouse Anatomical Location Age Overall (Days) Abdominal Dorsal Average 4 0.6 + 0.1(3) 2.0 - 0.3(4) 1.3 - 0.2 5 0.8(2) 2.2(2) 1.5 ñ 0.2 20 1.6 _ 0.5(3) 2.8 ñ 0.4(3) 2.2 _ 0.2 25 1.9 ñ 0.1(5) 4.4 ñ 0.5(5) 3.2 ñ 0.2 51 1.3 ñ 0.3(4) 1.6 ñ 0.6(4) 1.5 ñ 0.5 53 1.4 _ 0.2(5) b - - 59 1.4 ñ 0.4(9) b - - 85 1.1 + 0.3(10) • - - 102 1.5 ñ 0.4(6) • - - 110 1.3 ñ 0.3(10) • - - 114 1.4 ñ 0.4(3) • - - 134 1.0 + 0.5(3) b - - 158 0.9(2) • - - 210 0.7 - 0.2(4) 0.9 ñ 0.2(4) 0.8 +_ 0.2 270 1.1 ñ 0.1(5) 0.8 ñ 0.3(5) 0.9 ñ 0.2 360 0.6 -+- 0.1(5) 0.6 ñ 0.2(5) 0.6 ñ 0.2 Numbers in parentheses indicate numbers of animals used. From reference 15 and other works. DISCUSSION GENERAL PERMEABILITY BEHAVIOR Profiles of permeability as a function of age for water, methanol, ethanol, and butanol are qualitatively about the same (Figure 3). Permeation rates rise sharply to a peak seen at 25 days of age and then, just as abruptly, they decline over the next 25 or so days. There follows a period in which permeability coefficients are more or less stable. For some solutes the 25-day permeability coefficient is upwards of five-fold greater than seen as the stabilized value in mature animals. The rate of decline from the peak permeability at 25 days for hexanol and octanol appears slower than with the other permeants. One common feature of the data of all compounds is that a larger perme- ability coefficient is consistently found at the dorsal site than at the abdominal site for mice less than 50 days old. Past this age, the values for the dorsum and abdomen essentially come into coincidence. The only ages for which the permeability coefficients of all six permeants were evaluated both dorsally and abdominally are 4, 5, 20, 25, 53, 210, 270, and 360 days. These data are plotted semilogarithmically versus alkyl chain length in Figure 4 for each age. A common feature of these profiles is a sigmoidal shape with an exponentially increasing middle region between two plateaus. The exponentially increasing region results from an alkyl chain length partitioning dependency of the permeability coefficients which is mildly dampened by decrementally varying diffusivities as the molecules become larger. The methylene (-CH2-) sensitivity of permeability, dP/dn, is referred to as a Q-value. The estimated Q-values are plotted as a function of the age separately for the abdominal
Purchased for the exclusive use of nofirst nolast (unknown)
From: SCC Media Library & Resource Center (library.scconline.org)