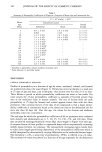
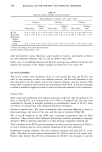
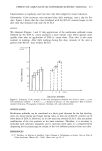
EFFECTS OF ADJUVANTS ON DIHYDROXYACETONE TANNING 269 Table III Emulsions Used for In Vivo Studies Apparent Viscosity Operating % Oil at Emulsions Conditions pH Phase 22.5 ø C A - O/W I ß 70 ø C ß II ß III ß B - O/W I ß II ß III ß C - W/O I ß II ß III ß PEG 12 stearate Stearic acid Cetyl alcohol PEG-4-isostearic glyceride Isopropyl myristate Preservatives Water M.S.O. Water Q.S. 6 g Warm I and II at 70 ø C. 1 g Pour II into I and mix 2 g with gentle stirring. 5 g Add III at 30 ø C. 5g 1.5 65.5 5g 100 g PEG- 12-stearate Cetyl alcohol Mineral oil Lanolin Glycerol 3.2 g Preservatives 1.5 g Water 61.3 g D.H.A. 2 g Water Q.S. 100 g Protegin ©* 30 g Isopropyl 3.5 g myristate Lanolin 2.5 g Propyl paraben 0.1 g Glycerol 5 g MgSO 4 0.5 g Water 45 g D.H.A 2 g Water Q.S. 100 g 8 g Warm I and II at 70øC. 1 g Pour II into I and mix 6 g with gentle stirring. 2 g Add III at 30 ø C. Warm I and II at 85 ø C and mix. At 60 ø C mix quickly with a vibrating mixer. Add III at 30 ø C. 6.49 19 % 3900 cp 6.48 17% 2000 cp 6.6 36% 9800 cp * Mixture of petrolatum, ozokerite, hydrogenated castor oil, glyceryl oleate, polyglyceryl-4-isostearate. D.H.A., emulsion B. Useful concentrations are 5% and 2%, respectively. Emulsion C was not useful due to a lack of development of the color. It seemed that D.H.A. was not released from the vehicle. APPLICATIONS Applications were made on different parts of the human body (back, thigh, forearm). Two areas composed of 3 squares (2 cm x 2 cm each) were marked on the thigh. The

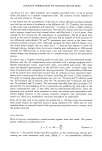
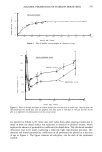
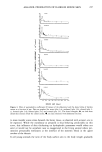
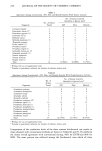
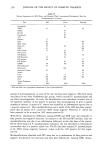
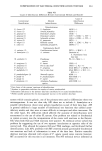
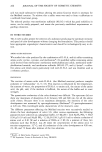
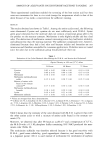
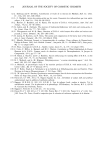
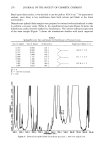
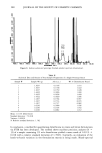
270 JOURNAL OF THE SOCIETY OF COSMETIC CHEMISTS right area was a control site and received only emulsion B containing D.H.A. The left area was the test site and received successively emulsion A containing M.S.O. and emulsion B containing D.H.A. Emulsions A and B were applied at a dosage of 5 mg/ cm 2. A control square and test square were rubbed once at times 0, 2, and 4 hours. All areas were photographed 6 hours after time 0 in order to have the three areas on the same slide and to thus appreciate the evolution of color. EVALUATION Co/or determination. In a first experiment, the color evaluation was done visually (Figure 1) with a scale of scores ranging from 0 to 20, twenty corresponding to the maximum intensity of color. Two evaluations by each of three evaluators were done with standard lighting. 20 15 1 2 3 4 5 6 hours 48 hours 5 days Time after treatment Figure 1. Evaluation of the intensity of the color development obtained with D.H.A. alone (.__.) and with methionine sulfoxide + D.H.A. (x x). Number of patients: 10. One application. Bars (I) indicate standard deviations. Evaluation by visible light. Two evaluations by each of three evaluators. (Score out of 20). Big arrows indicate different scales: hours, days. In order to get a more objective evaluation, all the treatment sites of a second exper- iment were photographed 6 hours after the beginning of assay under standard condi- tions: (a) Kodak © color film, 160 ASA artificial light (b) lighting: 4 lamps at 250 W each, 50 cm distant from the treatment site (c) field camera: Canon FTP, 60 cm from the subject and (d) shutter speed: 1/250 sec., diaphram 6. The slides were read with a photodensitometer with integration of the test areas, which permits quantitative evaluation of the intensity of the color.
Purchased for the exclusive use of nofirst nolast (unknown)
From: SCC Media Library & Resource Center (library.scconline.org)