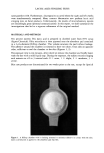
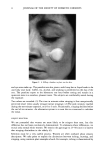
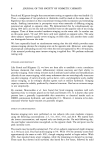
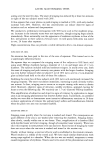
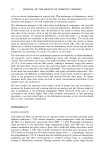
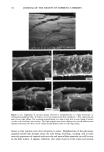
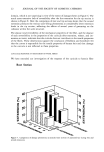
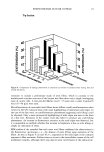
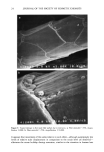
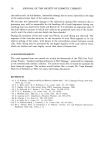
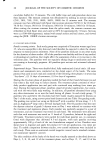
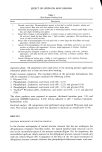
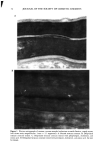
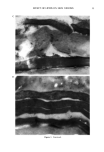
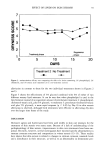
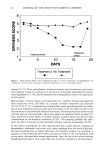
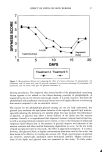
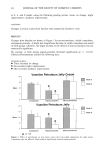
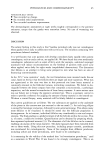
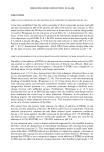
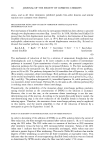
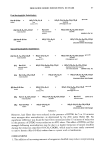
EFFECT OF LIPIDS ON SKIN XEROSIS 31 Table I Skin Dryness Grading Scale Grade Description Normal, moist skin. Dermatoglyphics present as bunched or stacked triangles, plump and evenly spaced. Skin tone even and uniform with a slight shine. Individual dermatoglyphics more visible due to whitening borders. Isolated small flakes of dry skin and slight wrinkling may appear. Broad white borders to dermatoglyphics, in which corners or small portions have started to lift and peel. Small dry skin flakes give a "light powdery" appearance. Skin puckering may occur, as well as small red dots. Entire sides of dermatoglyphics lift and peel back to create large dry skin flakes and rough appearance. Redness more evident. Almost all dermatoglyphics lift and demonstrate flaking, with flakes anchored at one end to produce an alligator skin appearance. Uneven, rough appearance is obvious. Uniform redness looks like mild sunburn. Dermatoglyphics disappear completely to produce flaking, cracking, and a dry, powdery appearance, with deep furrows and redness below, more like a moderate sunburn. Skin looks abraded. Intense flaking and scaling give a chalky or crusty appearance, with cracking, fissuring, extreme redness, and possibly open abrasions and bleeding. regression phase. All assessments were made prior to the morning product application (treatment phase) and at least one hour after washing. Product treatment comparisons. The treatment effects of the particular formulations that will be compared in this paper contained the following actives: 1. Glycerol (1%) 2. Phospholipid, cholesterol, and stearic acid (4%, 1:2:1) 3. Phospholipid, cholesterol, and stearic acid (4%, 1:2:1) and glycerol (1%) 4. Phospholipid, cholesterol, and stearic acid (4%, 1:2:1) and glycerol (5%) 5. Vaseline © Petroleum Jelly, cholesterol, and stearic acid (4%, 1:2:1) and glycerol (5%). The above products were prepared as aqueous, thickened (xanthan gum, 1%) and preserved (DMDM hydantoin, 0.2%) lotions adjusted to pH 7 (sodium hydroxide, hydrochloric acid). Statistical analysis. All comparisons were performed using repeated Wilcoxon rank sum tests. The critical significance level was adjusted to maintain an overall level of 5%. RESULTS ELECTRON MICROSCOPY OF STRATUM CORNEUM In the electron micrographs of normal stratum corneum that has not undergone the delipidization treatment described earlier, the typical lameilar lipid structure can be seen in the intercellular spaces of the stratum corneum (Figure 1A). In comparison, the intercellular lipids are clearly removed in the delipidized stratum corneum treated only with the vehicle (Figure lB). Comparison of the effect of the two lipid treatments on delipidized stratum corneum indicates that phospholipid-cholesterol-stearic acid treat-

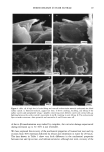
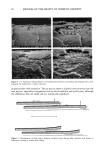
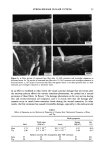
32 JOURNAL OF THE SOCIETY OF COSMETIC CHEMISTS A Figure 1. Electron micrographs of stratum corneum samples (ruthenium tetroxide fixation, uranyl acetate lead citrate stain magnification: 1 mm = 2.5 angstroms). A: Normal stratum corneum, B: Delipidized stratum corneum treated. C: Delipidized stratum corneum treated with phospholipid, cholesterol, and stearic acid. D: Delipidized stratum corneum treated with petrolatum, cholesterol, and stearic acid. See text for details.
Purchased for the exclusive use of nofirst nolast (unknown)
From: SCC Media Library & Resource Center (library.scconline.org)