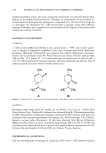
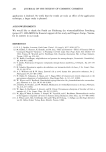
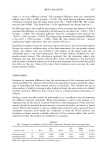
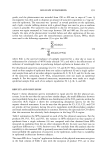
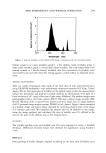
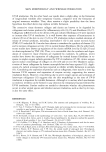
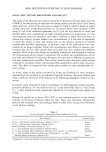
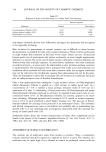
292 JOURNAL OF THE SOCIETY OF COSMETIC CHEMISTS 0.075 - 0.060 o.o45 0.030 0.015 0.000 • • • • • • • • • • • 290 300 310 320 330 340 350 360 370 380 390 400 Wavelength, nm Figure 1. The absorption spectra of physical sunscreen products normalized to equal area. agreement with those claimed by the manufacturer. Furthermore, the coefficients of variation for each product are generally smaller than those expected from in vivo assay of products of similar SPF (3), indicating that in vitro assay using excised human epidermis as a substrate is an extremely reliable technique. Therefore, while an in vivo SPF was not available for P35 +, we can infer from Table I that we expect the product to have an SPF of around 36 at an application thickness of 2 mg/cm 2. It should also be noted that the SPFs we obtained for each product increased with increasing TiO 2 concentration (p 0.0001 Spearman coefficient of rank correlation). In particular, P35 +, which contained 12% TiO2, offered significantly higher protection (SPF 36) than P35, which contained 8.6% TiO 2 (SPF 23) (p -- 0.02 Mann-Whitney U test). Table II gives the SPFs measured on epidermis from six volunteers (H-M) for the five organic chemical sunscreens. It can again be seen that, with the exception of product C50, the mean SPFs are in close agreement with those claimed by the manufacturer. The fact that the SPF of C50 is significantly less than 50 is not surprising since this product offered relatively little protection against UV-A radiation. UV-A contributes between 15 % and 25 % of the erythemal dose from sunlight, depending on latitude, season, time of day, and atmospheric conditions (10), and hence in the extreme case of a sunscreen that absorbs no UV-A radiation, the maximum SPF that can be achieved is only 6, irrespective of the concentration of UV-B absorbers. It is unlikely that a sunscreen offering as low a UV-A protection as C50 could, in practice, provide an SPF as high as 50. One reason for the discrepancy between the SPF we measured for C50 and that claimed by the manufacturer is the difference between the ultraviolet spectrum of natural sun-

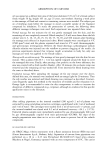
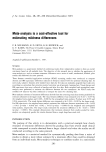
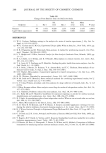
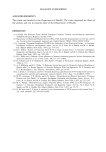
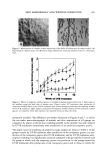
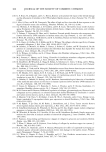
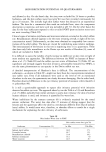
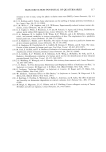
HIGH-SPF SUNSCREENS 293 0.09 - 0.075 - 0.060- 0.045- 0.030- 0.015 • c5 c15 ........ c25 - - - c30 .... c50 0 i I I i i I I I i •l 290 300 310 320 330 340 350 360 370 380 390 400 Wavelength, nm Figure 2. The absorption spectra of organic chemical sunscreen products normalized to equal area. Table I SPFs Obtained From Each Physical Sunscreen Quoted Sunscreen SPF A1 A2 A3 A4 B C D E F G Mean + SD P8 8 7.0 10.2 8.9 8.9 11.2 11.3 7.4 9.3 8.6 9.9 9.3 + 1.4 P15 15 15.3 15.7 14.0 13.9 14.3 9.8 13.9 13.4 12.7 11.3 13.4 _+ 1.8 P25 25 24.4 27.9 17.7 23.4 23.2 26.0 17.6 26.1 22.1 19.0 22.7 _+ 3.6 P35 35 23.4 20.7 22.1 31.4 22.6 21.0 18.1 21.1 26.4 24.9 23.2 + 3.7 P35+ •35 __a __ __ -- 41.3 43.1 18.3 38.7 36.9 35.0 35.6-+8.9 Al•4 represent the measurements on four samples of epidermis from subject A, and B-G represent measurements on epidermis from six other subjects. a Not evaluated with epidermis from subject A. light and that of a xenon arc solar simulator used for the in vivo testing of sunscreens. The in vitro method for determining SPFs described in this paper assumes a solar spectrum that represents the spectral irradiance expected at noon, on a clear midsum- mer's day, at latitude 40øN. In vivo testing of sunscreens, on the other hand, employs a xenon arc filtered by WG320 and UG11 optical filters. The purpose of the UG11 filter is to remove visible radiation, but it also attenuates the longer UV-A wavelengths (11). Hence, UV radiation from a solar simulator is deficient in UV-A1 (340-400 nm) relative to natural sunlight, and SPFs measured by in vivo testing would be expected to differ from those expected in natural sunlight. In the case of a sunscreen with strong UV-B absorption but weak UV-A absorption, the deficiency in UV-A absorption will be
Purchased for the exclusive use of nofirst nolast (unknown)
From: SCC Media Library & Resource Center (library.scconline.org)