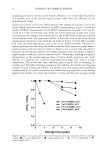
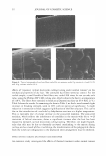
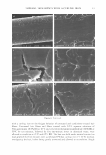
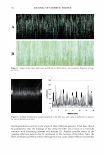
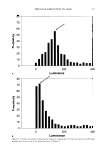
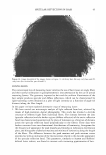
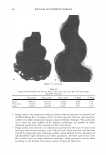
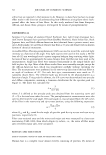
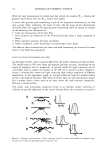
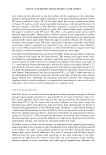
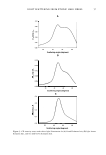
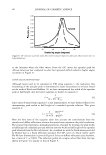
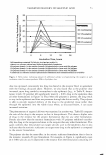
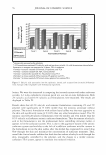
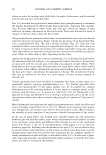
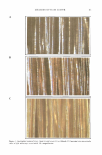
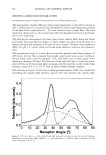
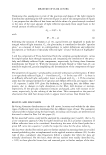
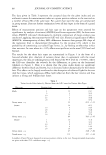
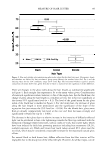
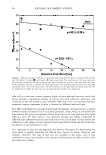
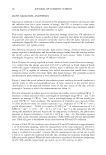
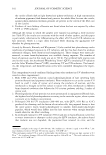
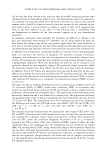
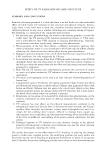
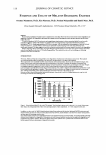
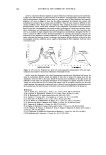
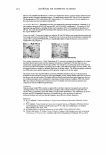
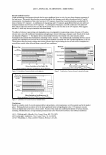
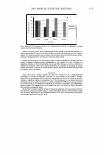
SPECULAR REFLECTION IN HAIR 31 synthetic sebum formula was prepared as a 5% (w/w) solution in hexane, as described previously (1). RES UL TS AND DISCUSSION QUALITATIVE DESCRIPTION OF MICROREFLECTION PATTERNS Figure lA shows a typical digital image of dark brown hair taken with a macro lens at a distance of 5 inches, illustrating the complexity of the structure of the reflection band. The white outline in the photograph presented in Figure lA highlights the region of the image that is shown at a higher magnification in Figure lB. Detailed examination of the pictures presented in Figure 1 reveals a series of light dots aligned with individual fibers. It is important to note that the image shown in Figure lB is not interpolated in any way and is shown without magnification. On the contrary, the image shown in Figure lA had to be reduced from its original size in order to fit into its current format. We address this detail since one may conclude that the multiple dot-like reflection patterns in Figure lB could be attributed to pixelation of the image. In order to further alleviate this concern, we performed similar experiments with a Nikon SLR 35-mm camera equipped with a 5 5-mm micro lens. Figure 2A provides a non-digital image of hair, obtained by using 100 ASA Kodachrome film, with a field of view similar to that shown in Figure lA. An enlargement of the inset in Figure 2A results in a more detailed view, which is shown in Figure 2B. The result confirms that the dot-like texture of reflected light is not an artifact of digital imaging. For further illustration, Figure 3 contains digital photographs of a person's head in natural sunlight. The magnified view in Figure 3 is a close-up shot of the specular band located in the crown region of the subject's head. Again, a series of dots corresponding to individual fibers can be observed to pervade the entire reflection band. These photographs, obtained by using natural, solar illumination, suggest that the observed structure of reflected light in the shine apparatus is not an artifact related to the use of the halogen light source. In our previous publication, we demonstrated the dulling effect produced on hair as a result of treatment with artificial sebum (1). Figure 4B presents a corresponding close-up image obtained for hair treated in the same manner, along with untreated dark brown hair (Figure 4A). While the microreflection patterns are clearly evident in the sebum treated hair, the contrast between the specular reflection centers and the diffuse reflec tion (background) is much greater for untreated hair than for sebum-treated hair. As yet another example, natural white hair, is compared with dark brown hair in Figure 5. Similar to sebum-treated hair, micro-reflection patterns are visible for natural white hair, although the contrast between the specular reflection (dots) and the background is much greater for dark brown than for natural white hair. IMAGE ANALYSIS OF MICROREFLECTION PATTERNS In order to quantitatively characterize the microcontrast effects arising from the presence of dots (highlights) and neighboring shadows (diffuse reflection areas) in the specular reflection band of hair, we measured the light intensity as a function of distance in the horizontal direction relative to the fiber axis. This is shown pictorially and graphically in Figures 6A and 6B, in which 250 lines (represented by horizontal lines in Figure 6A)

32 JOURNAL OF COSMETIC SCIENCE Figure 1. (A) Image of virgin dark brown hair at close proximity with a digital camera. (B) The inset, without interpolation, shown in Part A, providing higher magnification. Exposure settings: f8, l/l 3s. scanned the image and determined light intensity as a function of the horizontal dis tance. The horizontal lines were one pixel wide and the vertical distance between neighboring lines was four pixels. The graph shown in Figure 6B provides a demon stration of the light intensity profile for one of the lines. As shown in the figure, the plot consists of a complex curve containing a series of peak maxima and minima. The light intensity is measured with the software Sigma Scan Pro 5.0, while the resulting data are
Purchased for the exclusive use of nofirst nolast (unknown)
From: SCC Media Library & Resource Center (library.scconline.org)