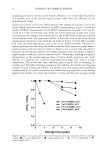
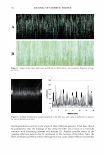
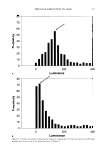
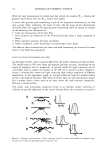
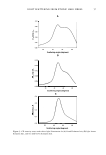
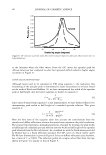
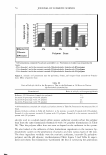
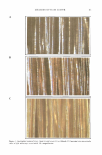
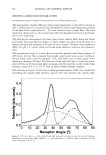
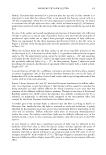
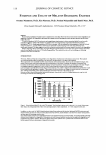
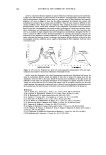
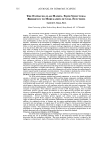
MEASURE OF HAIR LUSTER 87 Dismissing this assumption in view of the positions and shapes of the light intensity distributions underlying the GP curves (see Figure 2) and of our interpretation of Figure 1, we propose that the effect of hair luster and of the shine of a given hairstyle is related to the ratio of the total amount of light reflected specularly from single hairs to the overall amount of reflected light: GL = S/(D + S) (3) with (4) Following the notation of Stamm et al. (5 ), capital letters are employed to mark the integral values of light intensity. Gv the gloss index, is considered to describe "specular gloss," as a measure of luster, in correspondence to earlier definitions and subjective descriptions as "brilliance of specularly reflected light" (2) and "brilliance of highlights" (3). S and the components of D are determined from the complete goniophotometric curves for single human hairs through separating and integrating the intensities of the specu larly and diffusely reflected light components, respectively, by fitting three Gaussian distributions (see Figure 2). With the exception of light blonde or white hair, D i can usually be neglected, greatly simplifying the determination of the components of equa tion 3. The properties of equation 3 are plausibly connected with practical observations. If there is no specularly reflected light, S = 0 and hence GL = 0. In the case of D = 0, there is no diffusely reflected light, and perfect luster is achieved with GL = 1. If the situation arises that the integral intensities of specular and diffuse reflections are equal so that S = D} equation 3 yields 50% gloss. By darkening or lightening hair, the diffuse com ponent, due to changes in light absorption in the fiber, will decrease or increase, respectively . If the specular component remains unchanged, gloss will increase or de crease, respectively, by the coloring of the hair alone. This corresponds to the practical observation that dark hair always tends to appear more lustrous than blonde hair. RESULTS AND DISCUSSION By fitting Gaussian distributions to the GP curves, locations and widths for the three types of reflected light were determined for the different types of hair. The parameter values and their changes along the hair length, including cuticle angle, are presented and discussed in detail in Part I of this paper (1 ). By far, most GP curves could well be analyzed by considering just Sand D s} that is, by a two-component approach. Only for light blonde hair did D i as a further component of diffuse reflection have to be considered. Introducing the areas of the fitted peaks for a given GP curve into equation 3 yields the respective value for the gloss index G v All data were checked for outliers prior to further analysis by assessing them in so-called normal probability plots as implemented in the applied statistics software (21 ). In this type of plot, cumulative data frequencies follow a straight line when the data are normally distributed. On this basis, three obvious outliers were readily identified (GL 10%) in these plots for brown hair and removed prior to further analysis of the data.

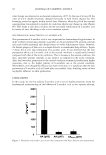
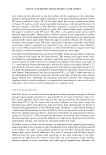
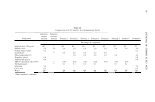
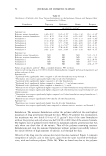
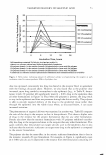
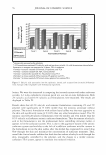
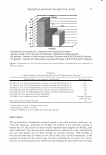
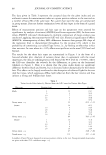
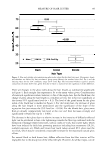
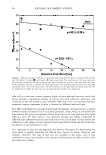
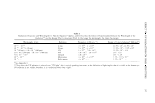
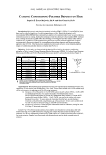
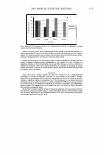
88 JOURNAL OF COSMETIC SCIENCE The data given in Table I represent the accepted data for the gloss index and are arithmetic means for measurements taken at a given position relative to the root end on a number of hairs (N) of the same type. For a given hair type the data are summarized in group means. Data are further summarized over all hair types in the form of a grand mean. Effects of measurement position and hair type on the parameters were assessed for significance by analysis of variance (ANOV A) and linear regression (LR). In those cases where ANOVA indicated inhomogeneity, multiple comparison of means analysis was conducted, applying the nonconservative LSD test (21). Statistical significance of effects (ANOV A: inhomogeneity of data LSD: differences between data groups LR: slope of the regression line) is characterized throughout by the a-value (22), which is the probability of committing a so-called Type I error, i.e., by finding an effect that in fact does not exist. In cases where a 0.05, effects are significant at the usual 95% level and beyond. The results for the three hair types are summarized in Figure 3 in the form of a box-and-whisker plot. Analysis of variance shows that, in agreement with the visual impression, the data are inhomogeneous well beyond the 95% level (a 0.0001), where the LSD test identifies the a-levels for the differences, as given on the horizontal whiskers in Figure 3. Here it is shown that the gloss index shows no significant difference between black and brown, but is decreased rather dramatically for the blonde hair. This effect can be largely attributed to the absorption of refracted light for the two dark hair types, which suppresses diffuse light reflection from the hair interior and thus induces a strong and brilliant hair luster. Table I Values for the Gloss Index G L Derived from the GP Curves for Various Hair Types Hair type Black Group mean ± q Brown Group mean ± q Blonde Group mean ± q Grand mean ± q Position (cm) 1 5 10 15 20 10 20 25 30 1 5 10 15 20 N CL(%) 12 64.1 3 53.2 7 59.3 3 59.8 7 57.4 32 60.2 ± 3.33 10 66.5 9 54.4 7 55.8 4 55.6 10 57.6 40 58.6 ± 3.05 10 31.8 9 32.2 9 30.7 9 14.9 10 14.7 47 24.8 ± 3.84 119 45.7 ± 3.66 A number of hairs (N) were measured at various positions relative co the root. Group and grand mean values are given with their 95% confidence range ± q.
Purchased for the exclusive use of nofirst nolast (unknown)
From: SCC Media Library & Resource Center (library.scconline.org)