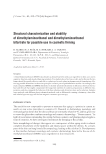
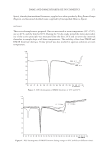
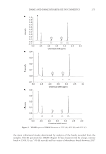
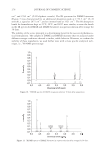
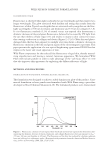
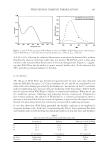
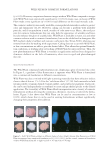
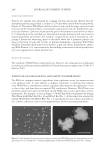
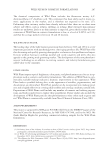
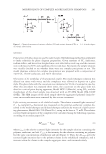
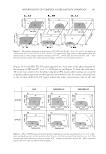
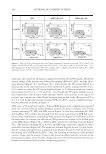
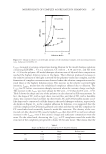
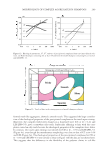
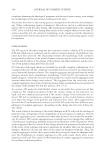
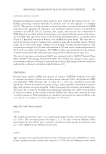
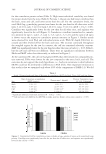
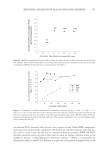
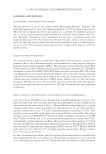
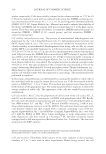
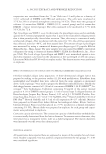
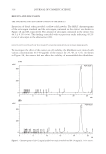
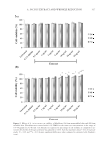
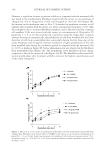
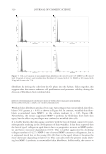
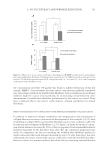
JOURNAL OF COSMETIC SCIENCE 292 Evaluation of rheological properties. Rheological measurements on the precipitated com- plexes were conducted using an oscillatory rheometer, Model RS-100 (Haake Co.), with a corn-plate (diameter=20 mm, angle=1°) within an angular frequency range of ω = 0.05-650 rad/sec. The Maxwell model for gels and polymer liquids (21–23) was used to calculate the parameters, i.e., the storage modulus of elasticity, G′, the loss modulus of elasticity, G′′, and the complex vis cosity, η*. RESULTS AND DISCUSSION DILUTION OF THE MODEL SHAMPOO SOLUTION AND COACERVATION OF THE COMPLEX Figure 3a–c shows the partial phase diagrams for the systems consisting of CC (α = 0.38, 0.21, and 0.10), LES, salt, and water. The upper diagrams are for the systems containing 1wt% CC, and the lower ones are for those containing 0.1wt% CC. The fi lled circle in each of the upper diagrams represents the composition of the model shampoo solution (CC = 1wt%, LES = 15wt%, and Na2SO4 = 3wt %) before dilution, and that in each of the lower diagrams gives the composition of the ten-times-diluted model shampoo solu- tion. The compositions for the diluted solution were in the complex precipitation region (CP) when the values of α for CC were 0.38 and 0.21, whereas the composition for the diluted solution at α = 0.10 lay in the region of a uniformly transparent solution (1ϕ), though the CP region also appeared at lower concentrations of the surfactant and salt. During the dilution of the model shampoo solution, the complexes deposited in the solu- tions containing CC with α = 0.38 and 0.21, while no precipitate was observed in the solution with α = 0.10. Hence, proper choices for the polymer structure and solution composition are necessary to reach the diluted composition in the CP region. PHASE DIAGRAMS BY MIXING SURFACTANTS AND THE MORPHOLOGY OF THE PRECIPITATED COMPLEX Partial phase diagrams. Figure 4a–f shows the partial phase diagrams for CC with α values of 0.38 and 0.21. The anionic charge was varied by mixing LEB (Figure 4a–f) and C18EO25 Figure 2. Relative scattered light intensity of solubilized complexes.

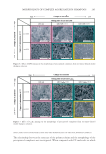
MORPHOLOGY OF COMPLEX AGGREGATES IN SHAMPOOS 293 (Figure 5a–f) with LES. The CP region appeared in a wide zone of the phase diagram for the mixture of LES and CC at α = 0.38 (Figure 4a and Figure 5a show the same data). This zone was connected to the phase separation (PS) region where salting out occurred to produce phase separation on the high salt concentration side. In contrast, the reduction in the α value shifted the CP region toward the lower concentration side of salt and Figure 3. Partial phase diagrams in the presence of CC, LES, and Na2SO4. In (a), (b), and (c), the degrees of cationization for CC are α=0.38, α=0.21, and α=0.10, respectively. The arrows in these fi gures show the dilution process of the sample solution containing 1wt% CC, 15wt% LES, and 3wt% Na2SO4. (CP = com- plex precipitation region, PS = phase separation region, and 1ϕ = clear one-phase solution.) Figure 4. Effect of LPB mixing on the partial phase diagrams for systems containing CC at 0.1 wt%, surfac- tant, and Na2SO4 as salt. (a), (b), and (c) are for CC at α = 0.38 (d), (e), and (f) are for CC at α = 0.21. The mixing ratio of the surfactant is given by weight. (CP = complex precipitation region, PS = phase separation region, and 1ϕ = clear one-phase solution region.)
Purchased for the exclusive use of nofirst nolast (unknown)
From: SCC Media Library & Resource Center (library.scconline.org)