JOURNAL OF COSMETIC SCIENCE 354 major antioxidant in the human epidermis, and that its depletion is an early and sensitive marker of environmental oxidative damage (5). Vitamin E is available as the free alcohol or its esters, and the benefi cial effects of vitamin E-containing cosmetic products depend on the concentration of added T and/or TA as well as their stability. Several analytical methods have been used to estimate the concentration of T and TA in pharmaceutical/cosmetic products and food supplements (6–8). Ruperes et al. reviewed chromatographic analysis of T and related compounds in food, pharmaceu- ticals, plants, animal tissues, etc., and pointed out the complications of the matrix in the analytical method (9). The authors indicated that sample preparation is a critical step, is time-consuming and expensive, and is the main source of errors in the analytical method. Moreover, it is worthwhile to mention that working with cosmetic products represents additional diffi culties due to the presence of many excipients/vehicles, e.g., fats, oils, and waxes, that possess a similar lipophylic nature as the analytes. Such materials are usually present in very high concentrations relative to the vitamins, which further complicates the analytical process. Although numerous methods for determination of T derivatives in pharmaceuticals such as tablets and capsules are described in the literature, no typical ana- lytical methods for determination of T and TA in actual commercial cosmetic products have been published (9). Guaratini et al. (8) reported on the stability of experimental cos- metic gel-cream formulations containing vitamin E acetate and vitamin A palmitate. Re- cently, Almeida et al. (10) documented an HPLC method for determination of tocopheyl acetate and ascorbyl tetraisopalmitate in an experimental cosmetic formulation. However, both studies (8,10) applied the proposed analytical methods on lab gel formulation, which in fact does not resemble the complex lipid matrices commonly encountered in commer- cial cosmetics. In addition, Dingler et al. (11) reported on an HPLC method for determina- tion of T in a dermal product however, the authors applied only cetyl palmitate as the lipid carrier, which does not simulate the actual complex nature of commercial products. Hence, the present study was carried out to develop a specifi c, precise, and accurate HPLC method for simultaneous determination of both T and TA in real commercial cosmetic prod- ucts. The investigation was focused on the development of an extraction procedure to selec- tively pick up the vitamin/ester from such cosmetics with good extraction effi ciency and to leave the commonly associated lipophylic materials. The results of the proposed HPLC method were validated using two experimental cosmetic creams simulating the complex cosmetic bases commonly experienced in real commercial products, each containing about 0.5% of T or TA, as well as four marketed cosmetic cream products containing TA. EXPERIMENTAL MATERIALS The methanol, acetonitrile, hexane, and ethanol used in the study were of HPLC grade (Merck, Darmstadt, Germany). Vitamin E acetate was obtained from BASF, Ludwig- shafen, Germany. Vitamin E, soybean oil, and corn oil were procured from Sigma Aldrich Chemie GmbH, Steinheim, Germany. Propylene glycol (Generico Medical Practice, AB Almere, Holland), stearic acid, white soft paraffi n, potassium hydroxide (Loba CHEMIE- India), lanoline, glycerol, sorbitol (Gainland Chemical Company, UK), Captex SBE, and Acconon S-35 (ABITEC Corporation, Janesville, USA) were of analytical grade.

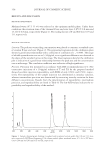
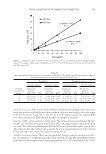
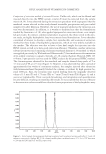
HPLC ANALYSIS OF VITAMIN E IN COSMETICS 355 METHODS Preparation of stock and working solutions. Stock solutions of T and TA in methanol (100– 500 μg/ml) were prepared in amber glass vials and kept refrigerated. The stock solutions were used to prepare standard solutions of T and TA in methanol, covering a concentra- tion range of 1–50 μg/ml. HPLC method. The proposed method involved a Waters 2690 HPLC (Waters 2690 Sepra- tions Module, Milford, MA) with a variable wavelength PDA detector, a disposable C-18 guard column, and an RP Waters Symmetry C-18 column (4.6 ratio × 150-mm, 5-μm particle size). The column temperature was maintained at 25°C. A series of drug solu- tions with a concentration range of 1–25 μg/ml, prepared as described above, was fi lled into sample tubes and loaded into the auto-injection chamber of the HPLC system. The system was programmed to inject each of the samples (50 μl) at a fl ow rate of 1.5 ml/min. The eluents were monitored at 290 nm and 283 nm for T and TA, respectively. The peak areas for T and TA were recorded, and analyzed using the Millennium Software Empower from Waters. The peak areas of T and TA were subjected to regression analysis against their concentrations. Method development. Initial trial experiments were conducted, in a view to select a suitable solvent system for the accurate estimation of the vitamin and to achieve good resolution between T and TA. The suitability of the mobile phase was decided on the basis of the sensitivity of the assay, the suitability for stability studies, the time required for the analysis, ease of preparation, and the use of readily available cost-effective solvents. These included acetonitrile-methanol (95:5 %v/v), acetonitrile (100 %v/v), methanol-water (70:30 %v/v), acetonitrile-water (90:10 %v/v), and methanol-water (97:3 %v/v). A mobile phase system comprising of methanol-water (97:3 %v/v) was found to be optimum, based on retention time, peak symmetry, and resolution. Method validation (a) Linearity. A series of standard curves was prepared over a concentration range of 5–50 μg/ml from a stock solution (500 μg/ml) in methanol. Dilutions were prepared in meth- anol too. The data of peak area versus drug concentration were treated by linear least- square regression analysis. The standard curves were evaluated for intraday and interday reproducibility. (b) Precision. The three components of precision, i.e., repeatability, intermediate preci- sion, and reproducibility, in accordance with ICH recommendations (11), were deter- mined as follows: • Repeatability. Five injections containing a mixture of T and TA (10 μg/ml each) were analyzed and %RSD was calculated for injection repeatability. • Intraday variation. Measurement of intraday variation of T and TA at three different concentrations (5, 10, and 25 μg/ml) was done by injecting the samples on the same day at different time intervals. • Intermediate precision (interday variation). Measurement of interday variation of T and TA mix solutions at three different concentrations (5, 10, and 25 μg/ml) on fi ve consecu- tive days determined the intermediate precision. (c) Accuracy. Accuracy is the measure of how close the experimental value is to the true value. Recovery studies by the standard addition method were performed in a
Purchased for the exclusive use of nofirst nolast (unknown)
From: SCC Media Library & Resource Center (library.scconline.org)