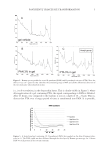
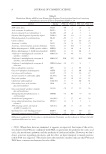
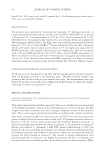
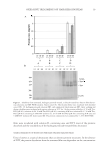
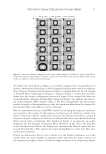
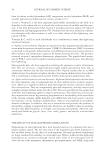
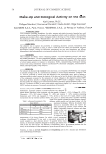
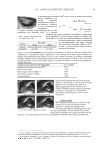
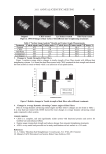
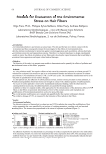
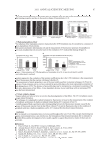
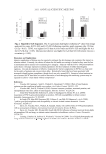
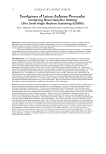
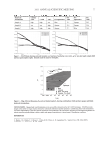
JOURNAL OF COSMETIC SCIENCE 8 Table II Metabolism Marker mRNAs from Human Skin Explants Treated with an Emulsion Containing D-panthenyl triacetate (PTA) or D-panthenol (PAN) at 2% mRNA Marker PTA 6 h PAN 6 h PTA 24 h PAN 24 h ATP citrate lyase ACLY -56 2 20 11 Acyl-coenzyme A synthetase FACL1 12 -7 4 -1 Acetyl-coenzyme A acetyltransferase 1 ACAT1 -29 -4 3 1 Pyruvate dehydrogenase (lipoamide) alpha 1 PDHA1 -40 -10 -1 -14 Dihydrolipoamide S-acetyltransferase DLAT -52 6 11 -12 Citrate synthase CS -23 15 49 23 Aconitase 1, soluble ACO1 -16 14 25 -23 Aconitase 2 mitochondrial, aconitate hydratase ACO2 72 191 7 26 Malate dehydrogenase 1, NAD (cytosolic soluble) MDH1 34 48 -6 -6 Malate dehydrogenase 2, NAD (mitochondrial) MDH2 11 8 62 -5 3-hydroxy-3-methylglutaryl-coenzyme A synthase 1 (soluble) HMGCS1 43 -61 0 -35 3-hydroxy-3-methylglutaryl-coenzyme A synthase 2 (metochondrial) HMGCS2 218 137 201 220 3-hydroxy-3-methylglutaryl-coenzyme A reductase HMG-CoAred -36 -15 8 7 Glucose phosphate isomerase GPI 14 -2 55 2 Glucose-6-phosphate dehydrogenase G6PD -25 -3 68 -14 Carnitine acetyltransferase CRAT -15 21 30 47 Acetyl-coenzyme A carboxylase alpha ACACA -50 32 4 36 Fatty acid synthase FAS -42 18 39 11 Cholesterol sulfotransferase SULT2B1 -9 7 60 51 Glucosidase, beta acid (includes glucosylceramidase) GBA -14 34 -3 6 Glucosylceramide synthase (ceramide glucosyltransferase) UGCG -20 12 33 36 Sphingomyelin phosphodiesterase 1, acid lysosomal SMPD1 -10 83 -37 -20 Arachidonate lipoxygenase 3 ALOXE3 -7 37 42 50 Serine palmitoyltransferase, long chain base subunit 1 SPTLC1 -32 -9 -4 -2 ATP-binding cassette, sub-family A (ABC1), member 12 ABCA12 -62 17 -36 18 Epidermal fatty acid-binding protein 5 FABP5 -34 -19 -65 13 Fatty acid transport protein (FATP) SLC27A4 -15 32 38 59 Differences (expressed as %) are versus a control emulsion. Treatment was for six hours or 24 hours. In bold: signifi cant differences (see text). (+59%). When these data are examined, it appears, as expected, that some of the activi- ties observed for PTA are confi rmed with PAN, in particular the push for the citric acid cycle, the mevalonate pathway, and the synthesis of cholesterol sulfate. However, we don’t detect activities regarding glycolysis, and the effect on lipid transport is mainly positive (while PTA was negative). The results from the metabolic markers indicate that PTA and PAN have common mechanisms but also differ.

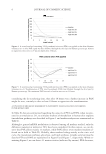
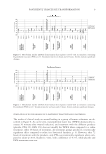
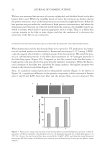
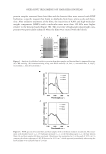
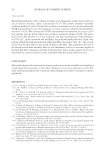
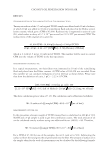
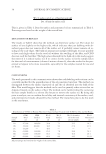
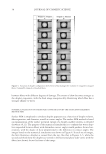
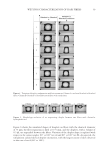
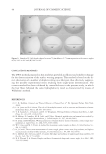
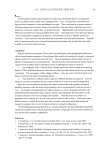
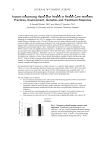
PANTHENYL TRIACETATE TRANSFORMATION 9 STIMULATION OF WOUND HEALING BY D-PANTHENYL TRIACETATE AND D-PANTHENOL The results of clinical study on wound healing in a group of human volunteers are de- scribed in Figure 8. As can be seen, transepidermal water loss (TEWL) dramatically in- creases 30 minutes after wound induction, and treatment with the different products (placebo, PTA 3%, PAN 3%) does not modify the TEWL when compared to a saline treatment. After 48 hours of treatment, all treatment groups produced a statistically signifi cant effect compared to saline (see Statistical Analysis, p. 4). However, after 72 hours of treatment with the products, only PTA was statistically signifi cant when com- pared to saline (p0.05, Student’s t-test), with a difference of -8.7%, while placebo and PAN treatments were not. Figure 7. Metabolism marker mRNAs from human skin explants treated with an emulsion containing D-panthenol (PAN) at 2%. Treatment was for six hours and 24 hours. Arrows indicate signifi cant changes. Figure 6. Metabolism marker mRNAs from human skin explants treated with an emulsion containing D-panthenyl triacetate (PTA) at 2%. Treatment was for six hours and 24 hours. Arrows indicate signifi cant changes.
Purchased for the exclusive use of nofirst nolast (unknown)
From: SCC Media Library & Resource Center (library.scconline.org)