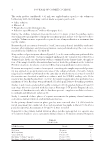
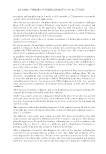
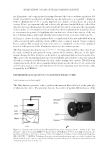
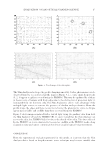
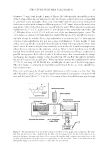
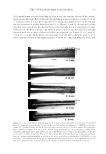
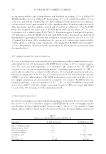
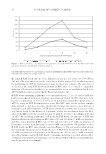
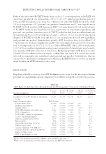
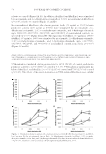
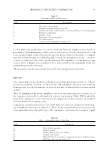
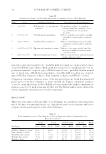
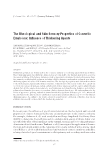
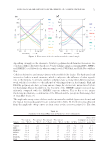
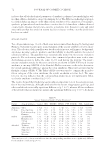
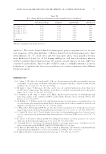
RHEOLOGICAL AND SKIN SENSORY PROPERTIES OF COSMETIC EMULSIONS 71 depending strongly on the shear rate. Synthetic polymer-based formulas were more vis- cous than cellulose derivative-based ones. Under shaking, samples containing HEC, HPMC, and HMHEC could fl ow freely, whereas samples with PVP, PAA, and PAA Na could not fl ow. Cellulose derivatives are linear polymers with modifi ed side chains. The hydrogen bond interaction leads to a weak structure, which is subject to the infl uence of other ingredi- ents in the formula. Conversely, synthetic polymers have a strong three-dimensional net- work, which is less subject to the infl uence of other ingredients in the formula. PAA and PAA Na polymers also have a strong anionic charge for electrostatic interactions for bet- ter thickening effi cacy. In addition, the viscosity of the HMHEC sample increased sig- nifi cantly compared with the HMHEC aqueous solution. This is due to its unique thickening mechanism, a combination of the H bond and the synergetic thickening effect of long alkyl chains (9). The amplitude sweep curves of these emulsions were also studied (fi gures not shown) and the typical rheological parameters are summarized in Table IV. Yield stress was obtained from the amplitude sweep curves as shear stress at the crossover point (10). The data Figure 1. Flow curves of the six emulsions and the control sample. T able IV Summary of the Typical Rheological Parameters of Seven Emulsions Sample Viscosity at 0.1 s-1 (Pa·S) Viscosity at 1 s-1 (Pa·S) Viscosity at 10 s-1 (Pa·S) Viscosity at 100 s-1 (Pa·S) G′ (Pa) G″ (Pa) Damping factor (1) Shear stress at crossover point (Pa) Control 11.6 2.6 0.6 0.2 21.3 9.2 0.4 2.7 HEC 34.9 10.5 2.9 0.7 47.4 33.3 0.7 13.1 HMHEC 36.8 8.9 2.1 0.5 47.3 29.6 0.6 8.4 HPMC 13.8 3.2 0.9 0.3 62.7 35.9 0.6 6.0 PVP 254.0 56.2 15.9 3.1 1,010.0 141.0 0.1 46.5 PAA Na 539.0 122.0 22.9 3.9 1,730.0 206.0 0.1 79.6 PAA 361.0 87.2 19.5 3.3 838.0 105.0 0.1 68.8

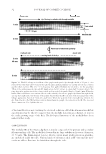
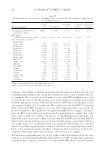
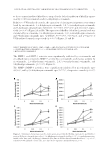
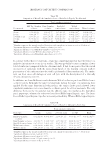
JOURNAL OF COSMETIC SCIENCE 72 indicate that all the rheological parameters of synthetic polymers have much higher val- ues than cellulose derivatives, except the damping factor. The difference in rheological proper- ties defi nitely has an impact on the skin sensory attributes of the emulsions. For example, synthetic polymer-based emulsions have a richer skin feel than their cellulose-derived counter parts, whereas the latter are easier to spread into skin. Lower viscosity and yield stress indicate that the emulsion system has less resistance to fl ow, once the yield stress has been exceeded. SENSORY ANALYSIS Ten college students (age 19–24) of both sexes were recruited from Beijing Technology and Business University to participate in an evaluation of the sensory attributes of seven emul- sions. The selection of the panellists was based on their interest, willingness, background, experience in using cosmetic products, and their ability to describe and rate the selected sensorial attributes. The panellists were systematically trained on the sensory evaluation protocols. For each sensory attribute, four to fi ve commercial products were used as stan- dard reference points to defi ne the scales (0–10) used during the training. The panel’s sensory evaluation results for the seven emulsions are shown in Table V. For each sensory attribute, a one-way ANOVA of the Kruskal–Wallist tests was conducted to determine the overall signifi cant difference among the seven emulsions. The results are listed in the far-right column of Table V. The Tukey’s HSD tests were used to compare the mean be- tween each pair of the seven emulsions the results are shown as letters A–C. The same letter in one row indicates that the corresponding emulsions are not signifi cantly differ- ent for the attribute considered (p 0.05). The results showed that thickening agents play an important role in the sensory proper- ties of the fi nal formulas. All eight attributes for the factors of appearance, pick-up, and rub-in exhibited statistically signifi cant differences (p 0.05), whereas all fi ve attributes of the after-feel factors showed no statistically signifi cant differences ( p 0.05). As shown Table V Sensory Evaluation Results of Seven Emulsionsa Factors Sensory attributes Control HEC HMHEC HPMC PVP PAA Na PAA Signifi cance Appearance Gloss 6.8 ab 7.0 a 7.1 a 6.7 ab 4.7 c 5.9 b 6.4 ab 0.0001 Pick-up Ease of pick-up 4.3 b 4.5 b 4.3 b 3.8 b 6.2 a 5.8 a 4.3 b 0.0001 Peak after pick-up 2.6 c 3.6 b 3.4 bc 3.1 bc 5.5 a 5.1 a 4.6 a 0.0001 Firmness 2.0 c 3.3 b 3.1 bc 2.6 bc 6.6 a 6.1 a 5.6 a 0.0001 Rub-in Spreadability 6.7 a 5.5 ab 5.8 ab 5.8 ab 4.9 b 4.8 b 5.0 b 0.02 Hydration feel 6.9 a 5.4 ab 5.5 ab 6.3 ab 4.8 b 4.9 b 5.5 ab 0.01 Oil feel 4.2 ab 4.4 ab 4.1 b 4.3 ab 6.0 a 5.3 ab 4.4 ab 0.02 Absorbency 5.9 a 6.1 a 7.2 a 6.6 a 7.5 a 7.8 a 7.4 a 0.03 After-feel Tackiness 2.9 a 3.3 a 3.2 a 3.3 a 4.7 a 3.7 a 3.8 a 0.26 Gloss (after-feel) 3.4 a 3.5 a 3.5 a 3.5 a 4.8 a 4.3 a 3.8 a 0.32 Slipperiness 5.4 a 6.2 a 6.1 a 6.1 a 6.2 a 6.1 a 5.7 a 0.89 Greasiness 3.3 a 2.8 a 3.3 a 3.5 a 3.8 a 4.0 a 3.4 a 0.62 Moisture 4.5 a 4.6 a 4.8 a 4.4 a 5.1 a 4.6 a 4.7 a 0.26 a The same letter (a, b, c) in one row indicates that the corresponding emulsions are not signifi cantly different for the attribute considered (p 0.05).
Purchased for the exclusive use of nofirst nolast (unknown)
From: SCC Media Library & Resource Center (library.scconline.org)