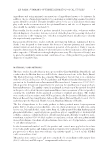
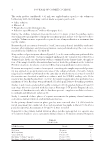
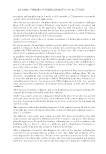
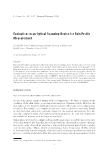
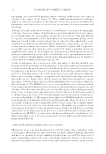
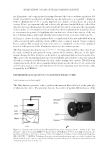
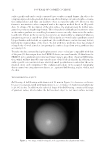
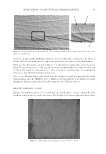
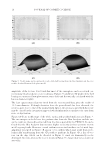
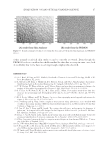
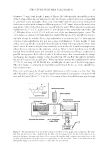
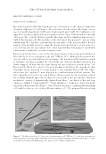
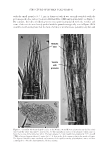
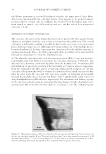
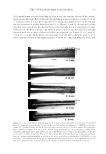
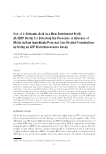
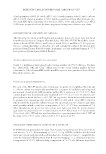
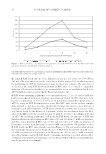
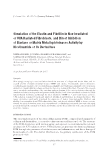
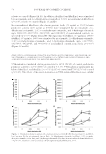
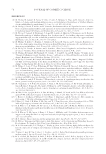
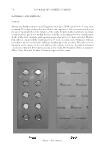
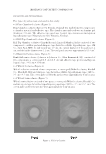
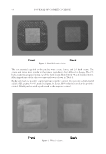
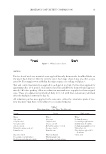
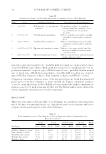
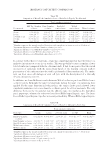
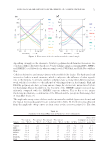
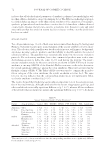
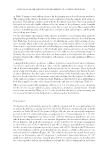
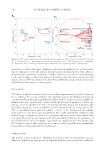
EVALUATION ON AN OPTICAL SCANNING DEVICE 13 Figure 3. Repli ca made from the dorsal side of a volunteer’s hand and one region selected for the conve- nience of comparison. methods. A matt paint uniformly sprayed onto the ball surface eliminates the effect of mirror refl ection from the metal component and makes the surface nearly Lambertian. Replica of skin. The replica shown in Figure 3 is taken from normal skin on the back of a hand. The reconstruction is only carried out on an area defi ned by the window with a size of 140 × 100 pixels (or a physical size of 3.28 × 2.34 mm) to avoid the effect of accumulated errors associated with the integration process. Skin in vivo. Normal skin on the dorsal side of a volunteer’s hand is acquired by both the Skin Analyzer and the PRIMOS device. Markers shown in Figure 4 are drawn for rough alignment during acquisition of data by using the two different devices. RESULTS AND DISCUSSION Figures 5A and B are plots of recovered and calculated surface vectors composed of the gradient components in x and y directions. The length of the arrow represents the relative Figure 4. Skin su rface on the dorsal side of a volunteer’s hand.

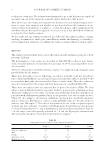
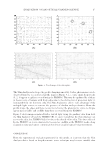
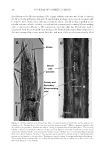
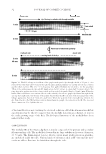
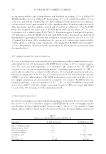
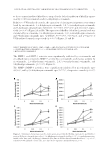
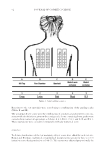
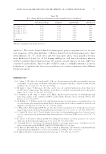
JOURNAL OF COSMETIC SCIENCE 14 Figure 5. Needle ma ps and reconstructed results of the ball bearing from the Skin Analyzer and theoretic results calculated from an ideal sphere model. amplitude of the vectors. It is found that most of the semisphere can be recovered cor- rectly using the photometric stereo technique. Figures 5C and D are 3D profi le of the ball bearing reconstructed from photometric stereo (left) and theoretically calculated with the known diameter (right). The least squares mean diameter fi tted from the reconstructed data gives the results of 10.2 mm diameter. Although deviation from the ground truth has been observed, the result is quite close to that of the ground truth. In fact, the error associated with the result may be caused by the integration approach which inherently accumulates the error from noise or digitization. Figure 6A–D are needle maps of the whole replica and specifi ed smaller area in Figure 3. The two images on the left are the gradient data from the Skin Analyzer and the two on the right are the results extracted from the data acquired by the PRIMOS. It can be found that the Skin Analyzer demonstrates higher sensitivity as there are more vectors with long amplitude. However, several evident vectors (within three circles) with large amplitude presented in Figure 6B appear to be outliers which may result from prob- lematically transforming from the 3D profi le to gradient. In Figure 6D, a line of vec- tors (on the edge which can be observed in Figure 3) stand out dramatically in the downward direction, whereas the vectors shown in Figure 6C change their values relatively smoothly.
Purchased for the exclusive use of nofirst nolast (unknown)
From: SCC Media Library & Resource Center (library.scconline.org)