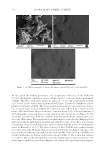
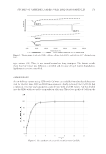
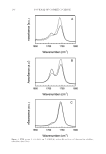
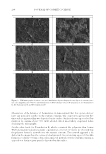
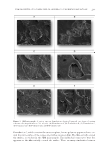
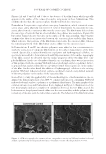
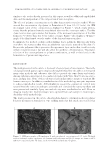
STUDIES OF CAFFEINE-LOADED SOLID LIPID NANOPARTICLES 167 SCANNING ELECTRON MICROSCOPY (SEM) ANALYSIS The nanostructure of the samples was observed using SEM (EVO 40 Carl Zeiss AG, Dresden, Germany). After drying the samples in the oven, they were coated with 15 mm gold-palladium and analyzed using SEM (11). DIFFERENTIAL SCANNING CALORIMETRY (DSC) ANALYSIS DSC (Setaram DSC 131 evo, Caluire, France) analysis was performed to study thermal behavior of the materials. Approximately 6 mg of sample was used for each measurement. The raw materials were analyzed at a speed of 5°C/min in a 20–100°C temperature range. Free caffeine, unloaded (without caffeine) SLNs, and Caf-SLNs were scanned at the same rate speed at a scanning temperature ranging from 20 to 300°C (6). CAFFEINE ENCAPSULATION EFFICIENCY Caf encapsulation effi ciency was measured using an ultrafi ltration method. Caf-SLNs (4 ml) were placed in the upper chamber of an ultracentrifuge tube (Amicon® Ultra-4, 10kDa, Merck Millipore, Darmstadt, Germany). The fi ltered phase containing Caf was freeze-dried and then dissolved in dichloromethane, which was analyzed for Caf amount by using UV spectrophotometry at 273 nm. A calibration curve was generated using six solutions with a concentration range of 10–100 mg/ml, and the correlation coeffi cient was 0.99 [6]. Caf loading effi ciency was calculated using Equation 1 given by: Loading Efficiency (%) = (Actual amount of Caffeine in the SLNs/Theoretical amount of Caffeine in the SLNs) × 100 (1) IN VI TRO RELEASE STUDY Caf release from nanoparticles was performed using the dialysis bag technique (12,13). The dialysis bags (MWCO: 3,5 kDa, Spectrum Laboratories, Inc., CA) were soaked and preconditioned before the experiment. The required amount of formulation (2 ml) was placed into the preconditioned dialysis bag. Then, the dialysis bag was put in 200 ml phosphate buffered saline (pH: 5.5) and incubated in a thermostatic reciprocating shaker maintained at 37 ± 0.5°C and continuously shaken at 100 rpm. An aliquot of 1 ml of release medium was withdrawn at predetermined time intervals (0.08, 0.25, 0.50, 1, 2, 3, 6, 12, and 24 h) and replaced immediately with the same volume of fresh medium to maintain the sink conditions. The concentration of Caf in the aliquot was quantifi ed us- ing high-performance liquid chromatography (HPLC). HPLC ANALYSIS A pharmacopeia method was used for the HPLC analysis of Caf during release studies (14). For this purpose, an Agilent 1260 HPLC system (Agilent Technologies, Waldbronn,

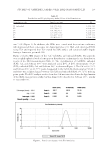
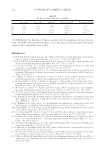
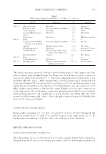
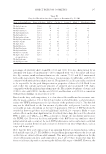
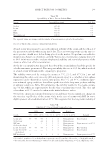
JOURNAL OF COSMETIC SCIENCE 168 Germany) consisting of a G1311B model quaternary pump, a G1329B model auto injec- tor, a G1316A model thermostat column compartment, and a G4212B model diode array detector (DAD) was used. The chromatograms were monitored and integrated using Agilent ChemStation software. Chromatographic separations of analytes were achieved on 5 μm Inertsil ODS-3 (4.6 × 250 mm) and the column was thermostated at 25 ± 1°C during analysis. The detection wavelength was 275 nm and injection volume was 20 ml. Elution of Caf from the column was performed isocratically with a mobile phase mixture of water:methanol (60:40) at a fl ow rate 1.0 ml/min. DATA ANALYSIS All experiments were repeated three times and the results were presented as mean ± SD. Release profi les were evaluated using different kinetic models including the zero order (Qt = Q0 + K0t), fi rst order (lnQt = lnQ0 + K1t), Higuchi (Qt = KHt1/2), Hixson–Crowell (Q0 1/3 - Q1 1/3 = KSt), and Korsmeyer–Peppas (Qt/Q = Ktn) models (15,16). RESULTS AND DISCUSSION In this study, Caf-SLNs were successfully prepared using double emulsion methods with the mixture of Softisan 100®, Span 20®, Caf, and Tween 20® (T20) at different ratios (Table I). The average particle size and size distribution of the formulations are shown in Table 2. Inclusion of Caf increased the particle size. The smallest average size (175.10 nm) was observed in the F4 formulation with 5.0% T20. According to several studies, SLNs with particle sizes ranging from ≈170 to 500 nm make a fi lm on the skin and provide an occlusive effect, which can increase the penetration rate of active agents across the stra- tum corneum (5,17,18). In this study, because of the low particle size and occlusive prop- erty of the SLNs, it is thought that Caf can easily pass through the stratum corneum (5,17–20). The PI values of the formulations were lower than 0.3. Kazemi et al. reported that PI 0.3 indicates great homogenous distribution (9). The zeta potential of the for- mulations was positive and in the range 0 to + 2 mV. Although zeta potentials of the particles were very low, increasing the T20 concentration resulted in smaller particles with good PI values. However, this behavior was not linear and further increase of T20 above 5.0% in F5 and F6 decreased the particle size. Higher T20 concentrations limit the dispersal of the primary emulsion phase (w/o emulsion) in the external phase and the second emulsifi cation process. These data clearly show that the T20 optimum concentration Table I Preparation of Caf-SLNs Formu lations Ingredients F1 (Unloaded, %) F2 (%) F3 (%) F4 (%) F5 (%) F6 (%) Softisan 100® 3.00 3.00 3.00 3.00 3.00 3.00 Tween 20® 5.00 1.00 3.00 5.00 7.00 10.00 Span 20® 0.20 0.20 0.20 0.20 0.20 0.20 Caffeine 0.00 0.10 0.10 0.10 0.10 0.10 Water 91.80 95.70 93.70 91.70 89.70 86.70
Purchased for the exclusive use of nofirst nolast (unknown)
From: SCC Media Library & Resource Center (library.scconline.org)