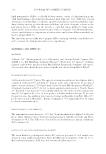
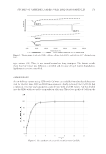
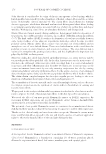
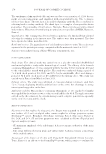
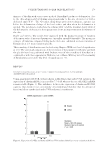
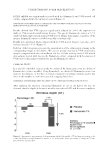
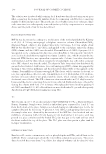
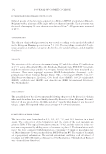
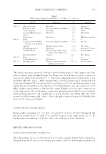
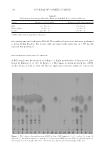
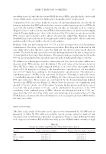
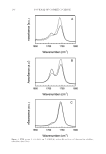
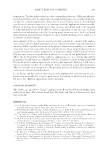
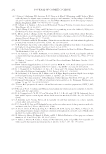
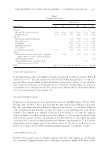
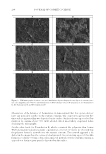
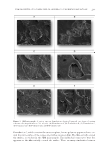
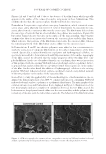
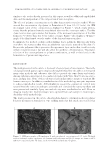
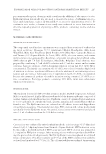
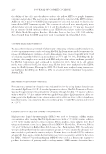
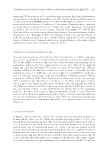
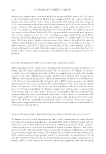
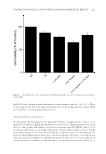
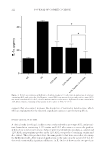
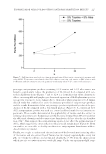
STUDIES OF CAFFEINE-LOADED SOLID LIPID NANOPARTICLES 169 was 5.0% (Figure 1). In addition, the SLNs were coated with the nonionic surfactant, which prevented their coalescence into larger particles (21). Shah et al. developed SLNs using T20 and reported that T20 coated the SLN surface and remained stable despite having a lower zeta potential (22). Figure 2 shows SEM images of free Caf, Caf-SLNs, and unloaded SLNs. The particles were roughly spherical with a homogenous distribution confi rming the size distribution results of the DLS measurements (Table 2). The crystallization of Caf-SLNs, unloaded SLNs, Caf, and Softisan 100® were analyzed using DSC. A DSC thermogram of Caf- SLNs, unloaded SLNs, Caf, and Softisan 100® is shown in Figure 3. The Caf at 236.76°C and Softisan 100® at 40.35°C peaks dissapeared in the Caf-SLNs thermogram at 38.44°C and there was a slight change between Caf-SLNs and unloaded SLNs (36.72°C) melting point peaks. The DSC analysis results show that Caf was introduced into the lipid matrix of the SLNs. In a previous study, Caf was found to be dissolved in Softisan 100®, similar to our results (6). Figure 1. Particle size diagram of the F4 formulation. Table II Particle Size and PI (polydispersity index) Values of the Formulations Formulation code Particle size (nm) PI F1 (unloaded) 161.27 ± 2.00 0.24 ± 0.02 F2 195.52 ± 9.77 0.26 ± 0.06 F3 181.68 ± 3.14 0.25 ± 0.03 F4 175.10 ± 5.68 0.22 ± 0.05 F5 196.80 ± 11.47 0.23 ± 0.01 F6 209.43 ± 10.05 0.28 ± 0.14

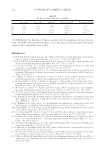
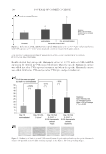
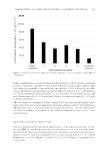
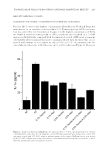
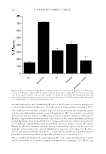
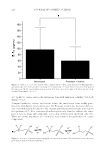
JOURNAL OF COSMETIC SCIENCE 170 At the end of the loading procedures, the encapsulation effi ciency of the SLNs was 49.22%. Hydrophilic substances such as caffeine tend not to dissolve in the lipid matrix of SLNs. Therefore, such active agents are expected to be poorly encapsulated in SLNs (23). In vitro release studies were performed and Figure 4 shows the cumulative release profi le of Caf from Caf-SLNs. The release profi le demonstrated a two-step release behav- ior an initial burst released without detectable lag time followed by a relatively slow release. The initial burst release in the fi rst 5 min was nearly 20% of the total amount of Caf followed by a sustained release of the remaining Caf over nearly 6 h (Figure 4). The initial burst of Caf release from the Caf-SLNs may originate from the Caf molecules clos- est to the SLN surface. The sustained release phase may be related to the diffusion of Caf molecules from the lipid matrix. In addition, it may be because of the effect of decreasing Caf amounts. Such release behavior also has been observed in the release of Caf from nio- somes by Khazaeli et al. (15). The release kinetics of the Caf-SLNs were evaluated using zero-order, fi rst-order, Higuchi, Hixson–Crowell, and Korsmeyer–Peppas equations. The results of the calculations indicated that the release profi le of the Caf from Caf-SLNs best fi t with the Korsmeyer–Peppas model release kinetics (Table 3). The n value was between 0.5 and 1.0, which indicated that the release mechanism was anomalous transport. The release kinetic model indicated both diffusion and erosion release patterns from polymeric Figure 2. (A) SEM micrographs of caffeine, (B) caffeine loaded SLNs, and (C) unloaded SLNs.
Purchased for the exclusive use of nofirst nolast (unknown)
From: SCC Media Library & Resource Center (library.scconline.org)