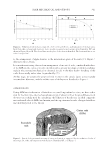
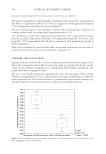
HAIR MECHANICAL ANISOTROPY 307 To acquire force curves, the AFM was operated in indentation mode, using a low trig- ger value (0.01 V) to detect the sample surface. Then an indentation of fi xed depth (maximum 25 nm, indentation rate 50 nm s-1) was performed. Using the Force Map mode of the AFM it was possible to obtain 196 force curves from 14 × 14 arrays, on 2 × 2 μm regions of the cortex of the hairs. A similar process was carried out for the polymer standards. For the cuticle regions, manual selection of the position of each force curve using the AFM software was performed. Using the polymer reference sam- ples and a nominal tip radius, R, of 10 nm for calculation, a calibration plot was con- structed, which could then be used to determine elastic modulus values for the hair samples. All indentation data were individually handled using a Microsoft Excel spreadsheet for curve fi tting, using the Hertz model for a spherical indenter (12), where the applied force, F, and the indentation depth, h, are related to the reduced modulus, E*, by * 0.5 4 = 3 ¸ ¸ ¸ E R h1.5 F (1) Values of the Young’s modulus, E, were obtained from E* by evaluation with the Pois- son’s ratios, as per equation (2) (13). 2 sample tip * sample tip 1– 1– 1 = + O O2 E E E (2) For soft sample s, where Esample is considerably lower than Etip, the second term in equa- tion (2) can be ignored. A value of 0.5 for the Poisson’s ratio was assumed for hair, in line with previously reported measurements on wool (14). THE MODEL A simple but widely used model, the 2-phase model, regards the cortex of hair as a com- posite material consisting of rods (the KIF) arranged parallel to the growing axis of the fi ber and contained in a less ordered matrix (15). This model allows for describing the Young’s moduli acquired along axial and transverse axes, respectively, by the “rule of mixtures” for composites (16,17). The orientations of the nanoindentation measurements are illustrated in Figure 1, for (a) cross sections, and (b) for longitudinal sections. Table I Polymers Used for Calibration (BASF SE, Ludw igshafen, Germany) Polymer Young’s modulus, GPa Poisson’s ratio, ν Low density polyethylene 0.2 0.43 High density polyethylene 1.3 0.46 Polypropylene 1.45 0.40 Polycarbonate 2.4 0.37 Polymethyl methacrylate 3.2 0.375

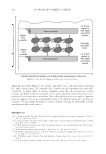
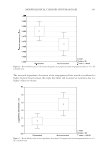
JOURNAL OF COSMETIC SCIENCE 308 This allows writing, for the axial and transverse moduli, the equations: ¸ ¸ Axial ROD ROD Matrix ROD = + 1– , E E x E x (3) ¯ ¸ ¸ ¸ ¢ ± Transverse ROD Matrix Matrix ROD ROD ROD = + 1– , E E E E x E x (4) where EROD and EMatrix are the Young’s moduli of rods and of the matrix, respectively, and xROD is the percentage contribution of rods to the total fi ber: ROD ROD fibre moisture = + x m m m (5) The percentage con tribution of rods to the total fi ber, equation (5), includes the changes due to sorption-desorption of moisture. This introduces the contribution of the relative humid- ity and temperature of the surrounding environment to the mechanical properties (18,19). As suggested qualitatively by Figure 1A and B, and quantitatively by equations (3) and (4), the hair fi bers should exhibit an asymmetrical behavior, i.e., they have anisotropic elasticity. For characterizing the anisotropy we defi ne an index, termed “index of an- isotropy”, IA, by taking the ratio of the two measurable axial and transverse Young’s moduli: ¯ ¯ ¢ ± ¸ ¸ ¸ ¸ ¸ ¢ ± ROD ROD Matrix ROD Matrix ROD ROD ROD Axial Transverse ROD Matrix + 1– + 1– = = E E x E x x E x E IA E E E (6) Defi ning the ratio of the Young’s moduli of rods to those of matrix: ROD Matrix = Y E E (7) the index of anisotr opy can be further expressed as: ¸ ¸ 2 Axial ROD ROD Transverse –1 = = 1– +1 Y E IA x x E Y (8) Figure 1. The indenting on cross-section (A) and on longitudinal section (B) of a hair fi ber schematically designed as a rod-matrix composite material.
Purchased for the exclusive use of nofirst nolast (unknown)
From: SCC Media Library & Resource Center (library.scconline.org)