FRAGRANCE RETENTION IN HAIR 365 for 45 min. They were rinsed with deionized water and left to dry at 45°C for 15 min. The analyses were performed in the microscope Olympus BX53 with a USH-103OL mercury burner. Fluorescence intensity was extracted from the images using Image Pro Premier software (Media Cybernetics, Rockville, MD). FRAGRANCE DEPOSITION Fragrance raw material compounds ethyl 2-methylbutanoate, linalool, benzyl acetate, and Mintonat were introduced in a shampoo formula at 0.1% (w/w) of each compound. Samples of 0.6 g of virgin and bleached hair were washed individually with 120 μl of a solution of the shampoo, presented in Table I, at 50%. The wet hair tresses were gently rubbed for 1 min from the roots to the tips and rinsed with tap water for 30 s and left to dry in controlled environment (60% RU at 22°C) for 2, 4, and 6 h. EXTRACTION OF VOLATILES BY SOLID-PHASE MICROEXTRACTION (SPME) Headspace sampling of the hair fragrance compounds was achieved in a sealed fl at bottom vial, immediately after the tresses insertion, and with triple gray SPME fi ber (CAR/ PDMS/DVB 50/30 μm diameter 2 cm length) from Supelco (Sigma-Aldrich, Darmstadt, Germany). For the desorption of the volatile compounds, the SPME fi ber was directly inserted into the chromatograph with an auto sampler. GC-MASS ANALYSIS GC-MS analyses were performed on an Agilent 6890 chromatograph coupled to an Agilent HP597 mass spectrometer (Agilent Technologies, Santa Clara, CA) with an electron ionization source operating at 70 eV and equipped with a fused silica capillary column ZB-1 (60 m × 0.25 mm × 0.25 μm) with 100% polydimethylsiloxane. Helium was used as the carrier gas (1.5 mL min-1), and the injector temperature was set to 250°C and the detector temperature to 260°C. Table I Shampoo Formulation Used to Embody Frag rance at 0.1% (w/w) of Each Compound Component % Water q.s. 100.00 Dissodium ethylenediamine tetraacetic acid 0.10 Sodium lauryl sulfate 37.00 Caprylyl glycol, 1,2-hexanediol, and 1-phenylethanol 0.50 Cocamidopropyl betaine 5.00 Trideceth-9, polyethylene glycol-5, isononanoate and water 1.00 Glycol distearate, sodium lauryl sulfate 3.00 PEG-150, distearate 1.00 Cocamide diethanolamine 1.00 Sodium chlorine 0.15 Fragrance 0.40

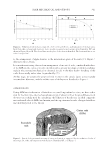
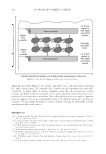
JOURNAL OF COSMETIC SCIENCE 366 DESORPTION OF WATER ON HAIR Triplicates of 2 g of virgin and bleached hair were placed in Eppendorf tubes (1.5 mL) and left to hydrate in a desiccator fl ask with distilled water in the bottom (RU 98–99% at 21°C) for 20 d. The hydrated hair mass was obtained in an analytical scale and placed in a desiccator with P2O5 (RU 0% at 21°C) (7) and the mass variation was acquired over the time. RESULTS AND DISCUSSION DSC ANALYSIS The DSC peak is associated with the temperature of denaturation of the hair keratinous materials. The area under the curve of the peak corresponds to the enthalpy of degrada- tion of the helical structures, represented by delta H (8). It is correlated with quantity and quality of the α-helical materials of the intermediate fi laments (IFs) of the hair (8–10). The obtained values for enthalpy variation and peak temperature from DSC analysis are presented in Table II. The numbers suffered important reductions because of the bleach- ing process in both parameters. Both variations have been associated by Wortmann et al. (8) to the loss of helical fi brous IFs and intermediate fi lament-associated proteins (IFAPs) caused by the bleaching process being the fi rst one even more affected, which explains the higher discrepancy of fi gures in the comparison of the virgin and the bleached hair. FLUORESCENCE MICROSCOPY ANALYSIS The level of damage of the hair can infl uence the fl uorescence intensity detected as rhoda- mine B presents higher affi nity to negative sites of the damaged hair. The bleached hair, therefore, is expected to present higher intensities than the virgin hair as the presence of sulfonic acid generated from the break of the disulfi de bonds is much more expressive (3). The fl uorescence intensity was calculated by the Image Analysis software in each captured image and then compared between the types of hair. In the fl uorescence microscopy analysis, the virgin hair presented values of fl uorescence intensity lower than three luminance as bleached hair presented fi gures fi ve times higher (Table II). These results are in accordance with the ones found by Pötsch and Moeller (11). Low fl uorescence intensity was evidenced in the virgin hair in investigations with rhoda- mine B as well, whereas damaged hair presented higher degrees of intensity. Table II Results Obtained for DSC Analysis and Fluorescence Microscopy for the Virgin and the Bleached Hair Type of hair H (J/g) Peak T (°C) Fluorescence intensity (Lum) Virgin 12.4777 ± 0.3579 147.6347 ± 0.5764 1,6415 ± 1,2177 Bleached 9.4066 ± 0.3407 141.9717 ± 0.5691 16,3907 ± 1,1158 Mean ± confi dence interval.
Purchased for the exclusive use of nofirst nolast (unknown)
From: SCC Media Library & Resource Center (library.scconline.org)