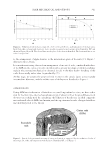
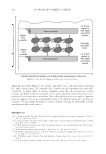
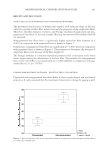
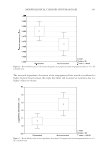
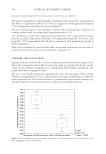
JOURNAL OF COSMETIC SCIENCE 374 Figure 3 shows results for a straight Caucasian hair tress oscillating at a frequency of 1 Hz. The oscillating tress displaces from the center point by approximately ±20°—resulting in a total amplitude of motion of about 40°. For comparison purposes, an identical experi- ment using decidedly curly/frizzy hair resulted in an amplitude of 28°, whereas Cauca- sian hair treated with a hair spray essentially gave a value of zero. Thus, a direct correlation between the magnitude of the measured amplitudes and the perceived motions of these tresses might be presumed—however, considerably greater complexity exists. The considerable infl uence of the oscillating frequency is another observation that arises from watching hair with natural and unnatural motion. In clean tresses, the nature of the motion varies signifi cantly with changing frequency however, this does not happen in hair treated with a hair spray. As possibly anticipated, application of progressively higher fre- quencies of motion initially produces higher amplitudes in clean tresses—but only up to a point. Eventually, application of still higher frequencies ultimately produces a decrease in this parameter—presumably as hair motion in one direction is stifl ed by the tress now being pulled in the opposite direction, before motion has fi nished in the original direction. Figure 4 shows examples of amplitude versus frequency curves for the aforementioned Caucasian, frizzy, and hair spray–treated hair. As already noted, the independence of the hair spray–treated hair on frequency is considered an aspect of unnatural motion. This graph illustrates how conclusions based on a single frequency can be misleading. That is, experi- ments at 1 Hz showed straight Caucasian hair producing a higher amplitude of motion than frizzy hair however, this trend is seen to reverse at higher frequencies. A value for the maximum attainable amplitude (Amax) for any particular test sample and the fre- quency at which it occurs (fmax), potentially become useful characterization parameters. HAIR TRESS EFFECTS In most in vitro hair testing experiments, the nature of the results can be greatly infl uenced by the properties of the hair itself and the size/shape of tresses. For example, when per- forming extremely popular instrumental combing experiments, it is desirable to initially Figure 3. Motion amplitude for a Caucasian hair tress under the application of a 1-Hz oscillating frequency.

QUANTIFYING HAIR MOTION 375 generate relatively high combing forces such that the lubricating benefi ts of products can more effectively be demonstrated. This can be attained by using somewhat thicker/denser tresses or, more economically, by chemically damaging the hair. Likewise, looking for shine benefi ts using very straight, heavily pigmented Asian hair would yield minimal sensitivity because of the already highly shiny innate state of the hair. For these reasons, it was considered prudent to look for contributions from the size, shape and nature of hair tresses on motion. In these experiments, longer 25 cm tresses of Asian hair were used that measured 7 g in weight. Instinctively, longer hair might be anticipated to yield more motion—but again, amplitude versus frequency curves suggest a more complex story. Figure 5 shows the effect of tress length on such experiments. Note: all experiments were performed on the same tresses, wherein the length was controlled by the use of a plastic cable tie. That is, the tie could initially be placed around the top of a tress—and then progressively slid downward to yield systematically shorter tress lengths. In general, reducing the tress length leads to amplitude versus frequency curves shifting upward and to the right (higher Amax and fmax). That is, higher amplitudes of motion can be attained but higher frequencies are required to produce this occurrence. Again the shape of these curves illustrates the danger of making conclusions from experiments at a single frequency. For example, from Figure 5, experiments at 1 Hz would suggest pro- gressively higher motion (amplitudes) with increasing hair length, whereas testing the exact same tresses at higher frequencies (≥1.6 Hz) yields the reverse conclusion. Meanwhile, Figure 4. Effect of hair type and treatment on amplitude versus frequency plots.
Purchased for the exclusive use of nofirst nolast (unknown)
From: SCC Media Library & Resource Center (library.scconline.org)