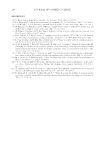
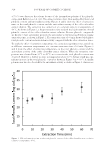
PREFORMULATION STUDIES OF PEPTIDES KTTKS AND PAL-KTTKS 303 Thermogravimetric ana lysis (TGA) was conducted to determine peptide decomposition. About 4–5 mg of peptide powder was weighed into an open TGA aluminum pan and heated from ambient temperature to 595°C at a heating rate of 10°C/min under a nitro- gen atmosphere. The experiment was performed in triplicate. Differential scanning c alorimetry (DSC) was performed for determination of peptides’ thermal characteristics. First, using indium as a standard, the DSC instrument was cali- brated. About 3–5 mg of peptide powder was then put into the DSC aluminum pan. The pan was sealed and thermal behavior studied at a heating rate of 10°C/min under a nitro- gen atmosphere. The experiment was performed in triplicate. In another experiment, a cycled heating method was used. First, the pans containing KTTKS or Pal-KTTKS were individually heated to 100°C, and after cooling, the same pans were reheated to 165°C. Cycled TGA experiments wer e also used here to interpret DSC data. In this experiment, the pan containing peptide was heated to 100°C at a heating rate of 5°C/min and then cooled to room temperature. The same pan was then heated again to 100°C at the same heating rate. Thermogram was then analyzed for any weight change. Stability studies. An aqueous solution of KTTKS was prepared at a concentration of 100 μg/mL and aliquoted into glass vials. The vials were then studied separately at 32°C in a water bath for 48 h. Peptide concentration was then measured by LC–MS, as described in the later section. The experiment was performed in triplicate. Peptide assay by LC-MS. The con centration of KTTKS was quantifi ed by a selected ion chromatogram method using an Agilent 6410 Triple Quad LC/MS system under the fol- lowing conditions: Capital C8-Optimal column (250 × 4.6 mm, i.e., 5 μm), isocratic elution, mobile phase of acetonitrile (40%): 20 mM ammonium acetate solution contain- ing 0.05% acetic acid glacial (60%), nitrogen dry gas at a temperature of 300°C and pressure of 25 psi, injection volume of 25 μL, and fl ow rate of 0.6 mL/min. A mass to charge (m/z) ratio of 564.2 was used to detect KTTKS. Statistical analysis. SPSS Statisti cs software version 21 .0 (IBM, Armonk, NY) was used for data analysis. Independent sample t-test was used to determine the statistical significance of data. Differences were considered to be significant for values of p 0.05. RESULTS PEPTIDE SYNTHESIS AND CHARACT ERIZATIO N Peptides, which were synthesized by S PPS using the Fmoc methodology, were confi rmed by mass spectrometry. The singly charged molecular ion [M+H]+ at an m/z of 564.2 and the doubly charged molecular ion [M+H]2+ at an m/z of 282.7 confi rmed the synthesis of KTTKS. In the case of Pal-KTTKS, [M+H]+ at an m/z of 802.3 and [M+H]2+ at an m/z of 401.7 confi rmed the synthesis of Pal-KTTKS. DETERMINATION OF UV ABSORBANCE Findin g an appropriate assay method t o quantify a drug candidate is an important step in preformulation studies. UV spectroscopy is a simple and widely available analytical method.

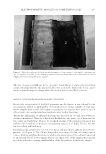
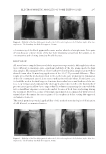
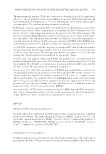
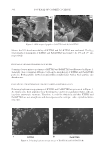
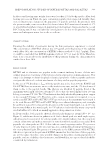
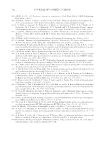
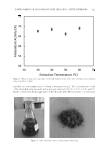
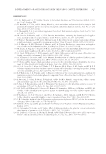
JOURNAL OF COSMETIC SCIENCE 304 Hence, the UV absorbance ability of KTTKS and Pal-KTTKS was evaluated. The λmax (wavelength of maximum) of KTTKS and Pal-KTTKS was found to be 193 and 195 nm, respectively. EVALUATION OF PARTICLE MORPHOLOGY BY S EM Scanning electron microscope images of KTTKS and Pal-KTTKS are illustrated in Figure 2. Generally, there is minimal difference between the morphology of KTTKS and Pal-KTTKS particles. Both peptides showed irregular fl ake morphologies with a wide particle size distribution. EVALUATIONS OF BIREFRINGENCE UNDER POL A RIZED LIGHT MICROSCOPY Polarizing light microscopy images of KTTKS and Pal-KTTKS are presented in Figure 3. As clearly seen, both peptides show birefringence under cross-polarized light, indicat- ing their anisotropic structure. Therefore, it could be defi nitely said that KTTKS and Pal-KTTKS are not amorphous and do not possess the isotropic cubic crystalline lattice structure. Figure 3. Polarizing ligh t microscopy images of KTTKS (A) and Pal-KTTKS (B). Figure 2. SEM images of p eptides: (A) KTTKS and (B) Pal-KTTKS.
Purchased for the exclusive use of nofirst nolast (unknown)
From: SCC Media Library & Resource Center (library.scconline.org)