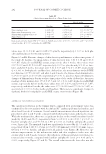
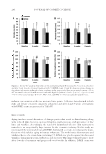
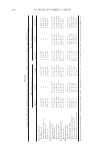
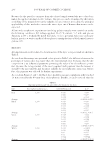
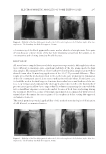
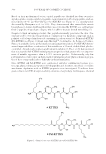
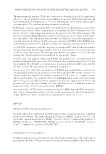
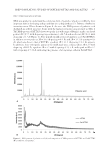
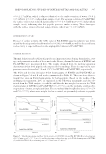
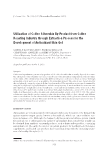
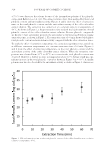
PREFORMULATION STUDIES OF PEPTIDES KTTKS AND PAL-KTTKS 307 69.0 ± 2.7 mN/m, which is almost identical to the surface tension of water (70.8 ± 0.05 mN/m) (p 0.05, independent sample t-test). For aqueous solution of Pal-KTTKS, the surface tension was reduced signifi cantly to 50.3 ± 0.4 mN/m (p 0.05, independent sample t-test), indicating that this peptide possesses surface activity. These data agree with the surface tension obtained using software, which was 50.1 ± 3 mN/m. DETERMINATION OF CMC Because of surface activity, the CMC value o f Pal-KTTKS aqueous s olution was deter- mined by the ring method and found to be 0.024 ± 0.004 mM as will be discussed later, such activity is expected based on the amphiphilic behavior of Pal-KTTKS. THERMAL BEHAVIOR Thermal behavior and stability of peptides are im portant issues du ring formulation, stor- age, and permeation studies of these molecules. Hence, thermal behaviors of KTTKS and Pal-KTTKS were investigated here. The results obtained from the melting apparatus demonstrated that both peptides decomposed before melting. Their decomposition tem- peratures were observed at 154 and 150°C for KTTKS and Pal-KTTKS, respectively. The TGA and the first derivative TGA thermograms of KTTKS and Pal-KT TKS are shown in Figure 5A and B and results summarized in Table III. There are three distinct weight loss areas in TGA thermograms for both peptides. Based on the results of the melting point apparatus, DSC (as explained in the following paragraph), and data ob- tained from the TGA analysis, it could be said that the fi rst weight loss area in the TGA thermograms of KTTKS and Pal-KTTKS (25–150°C) could be probably attributed to evaporation of water, as explained later. The second and third weight loss areas (150–250 and 250–595°C), where more weight loss has occurred, are presumably relevant to peptide Figure 5. TGA thermograms a n d their first derivatives for KTTKS (A) and Pal-KTTKS (B) at a heating rate of 10°C/min over 25–595°C (n = 3), and also heating–cooling–heating cycle TGA thermograms of KTTKS (C) and Pal-KTTKS (D) at a heating rate of 5°C/min over 25–100°C.

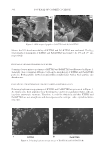
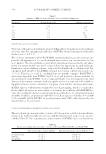
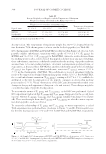
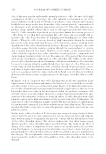
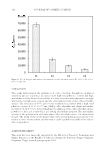
JOURNAL OF COSMETIC SCIENCE 308 decomposition. The temperature of maximum weight loss (230°C) obtained from the first derivative TGA thermograms is almost similar for both peptides (see Table III). DSC thermograms of KTTKS and Pal-KTTKS are illustrated in Figure 6A. As seen, both peptides exhibit endothermic transitions with a peak of 59.8 ± 1.3°C (T1 KTTKS ) for KTTKS and 50.6 ± 4.4°C (T1 Pal-KTTKS ) for Pal-KTTKS. Given the results obtained from the melting point studies, which showed that peptides did not show any sign of melting, these endothermic transitions could not be attributed to the melting of peptides and were assumed here to be water-related intrinsic structural rearrangement, polymorphism, or evaporation, as discussed later. KTTKS has another endothermic peak with low enthalpy (T2 KTTKS ) (see Figure 6A). A third endothermic transition (T3 KTTKS ) starts at 152.1 ± 3.9°C in the thermogram of KTTKS. This endotherm is in good agreement with the result of decomposition obtained from melting point studies (154°C). For Pal-KTTKS, the second endothermic transition (T2 Pal-KTTKS ), starting at 142.7 ± 0.9°C, could also be attributed to the fi rst decomposition of the peptide conjugate as observed in melting point studies (150°C). Visual observations of the DSC pan after removal revealed sever changes in the peptide appearance (change in color and texture). These changes might be considered as signs of peptide decomposition. To ascertain the nature of T1 KTTKS and T1 Pal-KTTKS , cycled DSC was performed. Cycled DSC experiment indicated that T1 KTTKS and T1 Pal-KTTKS disappeared in the second heat- ing run, whereas T2 KTTKS , T3 KTTKS , and T2 Pal-KTTKS remained unchanged (see Figure 6B). These results might show that T1 KTTKS and T1 Pal-KTTKS are related to water evapora- tion from peptides, as discussed later. To ensure the relationship of T1 KTTKS and T1 Pal-KTTKS to water evaporation, a cycled TGA experiment was performed here. As shown in Figure 5C and D, TGA weight losses for the fi rst heating runs are 5.9% and 3.3% for KTTKS and Pal-KTTKS, respectively. Table III Percent Weight Loss of Peptides and the Temperature of Maximum Weight Loss during TGA Study in the Range of 25–595°C Peptide name Weight loss (%) over three temperature ranges Temperature of maximum weight loss (°C) 25–150°C 150–250°C 250–595°C KTTKS 7.47 ± 0.84 45.34 ± 1.29 41.97 ± 1.03 233.92 ± 1.49 Pal-KTTKS 6.55 ± 0.99 33.61 ± 0.67 56.38 ± 0.67 229.26 ± 0.86 Data are represented as mean ± SD (n = 3). Figure 6. (A) Sample DSC thermograms o f KTTKS and Pal-KTTKS at a heating rate of 10°C/min over 25–165°C and (B) DSC thermograms of preheated–cooled KTTKS and Pal-KTTKS samples at a heating rate of 10°C/min over 25–165°C (see text for more explanation).
Purchased for the exclusive use of nofirst nolast (unknown)
From: SCC Media Library & Resource Center (library.scconline.org)