INHERENT INVALIDITY OF ODOR CLASSIFICATION with the Henning classification would indicate that, by its very nature, the Crocker-Henderson sys- tem must likewise produce incon- sistent results. Nevertheless, the first published data seemed to show that the results were somewhat re- producible. According to Professor E. G. Boring (34) of Harvard University, the Crocker-Henderson results were "very promising," there being "rel- atively great consistency for this difficult task." Examination of Boring's brief paper, however, re- veals that neither this psychologist nor any of his co-workers had ever tested the system, but that Crocker and Henderson supplied Boring, at the latter's suggestion, "with data showing the judgments of 25 stimuli made independently by Crocker, by Henderson, and by each of two untrained observers." Uti- lizing only four subjects, two of whom were the authors of the system and therefore could not help but agree upon it, and conducting the test under the supervision of the authors of the system--which is a far cry from independent verifica- tion-we do find "relatively great consistency." But let us not as- sign to an independent psychologist of standing work that was not accomplished by him. Professor Boring did nothing, according to his own paper, but tabulate results, draw conclusions, and write a paper. The results of each observer were compared with those of each of the other observers. Of a total of 600 such correlations, 150 digits were exactly the same, 256 differed by one number, 130 by two, 42 by three, etc. Whether the area of agreement and near-agreement is sufficiently close to consider these results reproducible, I shall not at this time investigate. The small number of subjects, the inclusion of the authors among them, and the method of conducting the observa- tions, would make mandatory a re- appraisal. The only professional psychological opinion of Boring's paper that I have been able to locate was written by Hazzard (31) and reads as follows: "Boring's favorable review of Crocker and Henderson's work ap- pears to be overoptimistic. There is a fundamental error in their method which seems to exclude the study from the group of reliable psychological experiments." More recently, the Crocker-Hen- derson system was tested three times namely, at Bucknell Uni- versity by Ross and Harriman (35) at Cornell University by Foster (36) and at the Arthur D. Little laboratories, the results of which have been described by Crocker, although the test was made inde- pendently of any knowledge or participation by Crocker (37). Ross and Harriman first set out to determine the number of qualita- tive groups into which 32 odors, previously selected by Crocker to typify each of the eight intensities of the four classes, would be placed by fifteen students. The subjects placed the 32 odors into 4 to 19 different groups.

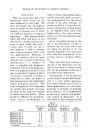
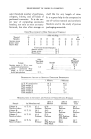
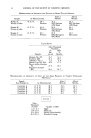
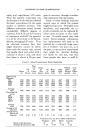
32 JOURNAL OF THE SOCIETY OF COSMETIC CHEMISTS Fifteen other subjects were then acquainted with the four Crocker- Henderson classes, and each was given the eight substances repre- senting the eight degrees of intensity for each class. The subjects were asked to arrange the odors within each group according to intensity of that odor quality. For example, acetic acid had been chosen by Crocker to represent the acid-odor intensity rating of eight, and methyl salicylate the fragrance rating of eight. Four subjects of the 15 agreed with this rating of acetic acid three gave it the next higher intensity one placed it third, and one fifth. One subject out of 15 agreed on methyl salicylate, and only three rated it as high as fourth. "Similar discrepancies hold in the rankings made for the burned series and caprylic series," the authors re- port. There is a maximum difference of seven places in intensity according to this method of arrangement, if one subject places an odor as the least fragrant, acidic, burnt, or caprylic of the eight, and another as TABLE 1--MAxIMUM INTENSITY DIFFER- ENCES •N ROss-HARRIWAN TESTS. Maximum Difference No. of Odors 0 0 1 0 2 0 3 2 4 2 5 16 6 5 7 7 -- 32 substances the most intense. Table 1 shows the maximum intensity differences when the 32 odors were assigned ratings by the 15 students. Fur- thermore, of the 64: extremes in which the highest or lowest intensity for the given material was cited, in 38 cases both digits were endorsed for the same substance and in the case of 11 substances, both the maximum and minimum were en- dorsed by at least two subjects. A comparison of the results ob- tained by each subject is made with one other subject, the subjects chosen in numerical order of presen- tation in the paper, and comparisons are made for each of the four odor groups. The results are given in Table 2. TABLE P. Odor Average Subjects Class Deviation 1 and :2 Fragrant 2.50 :2 and 3 Acid 2.75 3 and 4 Burned 1.75 4and 5 Caprylic 1.75 5and 6 Fragrant 3.00 6 and 7 Acid 2.25 7and 8 Burned 2 25 8 and 9 Caprylic 2.25 9 and 10 Fragrant 1.25 10 and 11 Acid 2.75 11 and 12 Burned 3.75 12 and 13 Caprylic 1.50 13 and 14 Fragrant 3.00 14 and 15 Acid 1.00 15 and 1 Burned 2.25 Maximum possible deviation: 4.0 or 100% disagreement Average deviation by law of chance: 2.625 or 65.6% disagreement Actual average deviation: 2.27 or 56.75% disagreement Summarizing their work, the authors point out that the arrange- ment of the eight odors in each series in terms of an intensity con- tinuum is not corroborated. Re-
Purchased for the exclusive use of nofirst nolast (unknown)
From: SCC Media Library & Resource Center (library.scconline.org)