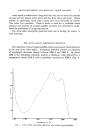
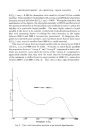
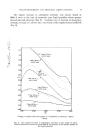
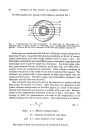
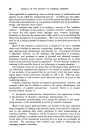
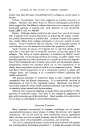
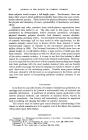
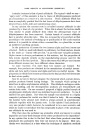
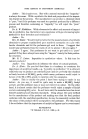
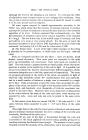
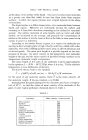
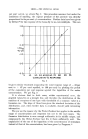
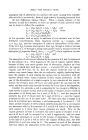
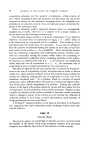
62 JOURNAL OF THE SOCIETY OF COSMETIC CHEMISTS (g) Odour Analysis. Provided that the stimulating strengths o[ two odours are approximately equal when a mixture of them is smelled, and that the composition of the vapour is constant, a blend is first perceived, followed by identification of each individual odour. The order in which they are identified depends on the speed of adaptation of the olfactory area to each, and to the mental attention given to their recognition. If one odour is moderately stronger than the other, the recognition of the blend is followed by that of the stronger, and lastly by that of the weaker as adaptation reduces the response to the stronger more rapidly than that to the weaker (this implies that speed of adaptation is a function of the intensity of stimulus). If the olfactory receptors were not differentiated, we would expect their adaptation to be to the total odour, and the perception to be unaltered in quality but reduced in intensity with time. That the bouquet of the odour changes with time points to receptor differences with respect to quality of perception, but not necessarily to speed of adaptation. (h) (i) Intensity of Perception. From analogy with the Weber-Fechner law applicable to the case of the sensation responding to heat, pressure, hearing, etc., the intensity of perception of an odorant would be expected to be a log function of the intensity of the stimulant. In the case of smell, the stimulant is the energy transferred by adsorbed molecules to the surface. For any one gas it is proportional to the number of molecules of the odorant adsorbed on the receptor area in unit time, which we have seen is directly proportional to the vapour pressure and inversely proportional to the mole- cular weight and the temperature. In our particular case, because heat of adsorption, molecular weight and temperature are constant, the stimulating intensity for any given substance is therefore proportional to the vapour pressure of the substance. In Part II we saw that the response of a nerve to increasing stimulation is by no means uniform, for, as the stimulus increases it evokes responses in increasing numbers of single fibres as it passes their stimulation threshold. We would expect the ease of stimulation of any one specific type of receptor to vary amongst these types in a random distribution and, due to complete lack of information concerning this distribution, our best assumption concerning it is that it is a normal or Gaussian distribution. In that event, any data regarding the intensity of response to odour stimulation should give a straight line when the probit of the cumulative per cent response is graphed against a function of the stimulus (Middleton•8). Data for man of the intensity of perception of anethole in solution in white oil is given by Hainer et al •4 Fig. 5, and the experimental values can be extracted from this figure. When the probit of the cumulative per cent intensity, calculated after classifying the response from 100 per cent anethole as 100 per cent response, is plotted against the logarithm of the concentration

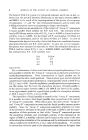
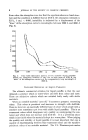
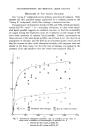
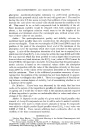
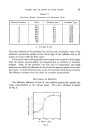
SMELL--THE PHYSICAL SENSE 63 per cent vol/vol, we obtain Fig. 2. This procedure assumes that under the conditions of smelling, the vapour pressure of the anethole was directly proportional to its per cent v/v concentration. Further data have been given by Dethier •' for the response of the house-fly to iso-valeraldehyde. This can / , / / , / / I.( LOG K O/o v/v -3.( 5 IO 20 30 ,40 50 60 70 80 90 05 CUMULATIVE ø/o RESPONSE Fig. 2 be given similar treatment (expanding the total response range of -- 23 per cent to + 67 per cent repelled, to 100 per cent) by plotting the probit of the cumulative per cent response against the logarithm of the molar concentration. We get Fig. 3. It is obvious that in both cases, within experimental error, the graphed values lie on a straight line, and therefore the distribution of the numbers of receptors of one type with thresholds of a common value is a Gaussian one. The slope of these lines gives the standard deviation of the distribution, and, when further data is available, should yield interesting information. We now see the reason why the Weber-Fechner law applies to the middle range of concentrations and responses but not to the end ranges. The Gaussian distribution is near enough arithmetic in its middle ranges, and consequently the Weber-Fechner law fits it there sufficiently well. The explanation of the use of the logarithm of the concentration of stimulant, instead of that of the concentration, has been given by Ferguson. •,
Purchased for the exclusive use of nofirst nolast (unknown)
From: SCC Media Library & Resource Center (library.scconline.org)