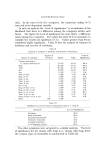
170 JOURNAL OF THE SOCIETY OF COSMETIC CHEMISTS were concerned more with electrolyte-emulsifier interactions rather than their effect on the emulsion system (1-3). In this paper it will be shown that, in formulations containing cer- tain nonionic ethoxylates, emulsion stability may be enhanced or diminished by the addition of specific quantities of various electrolytes. From a study of variations of surface-related measurements of several polyoxyethylene ethers by added electrolytes, a mechanism of electrolyte emulsion interactions may be postulated. EXPERIMENTAL The surface-active •aterials used in the formulations were a series of ethoxylated fatty alcohols. The Siponics•, * in which the series number is multiplied by 2 to obtain the degree of ethoxylation, were used. The exceptions to this rule are Siponic EO and Siponol TX•* the former contains one molecule of ethylene oxide and the latter none. The ethylene oxide content of the emulsifiers used in the experimental formulations ranged from 10 to 30 molecules per fatty alcohol molecule. The ethoxylates were the sole emulsifiers used in all formulations. All added electrolytes were reagent grade. Preparation of Emulsions The formulations were made by combining two emulsion phases. The electrolytes were placed in the aqueous phase, while mineral oil (65/75 Saybolt) and ethoxylate were considered to be the oil phase. This procedure was used because, in a preliminary series, conductivity and dispersibility measurements indicated that the particular ethoxy- lates chosen formed O/W emulsions. It was also ascertained that emulsion stability was somewhat enhanced when the ethoxylate was included in the oil phase. All the electrolytes were water-soluble. The two emulsion phases were placed separately in two 1500 ml Pyrex beakers and heated in a hot water bath to 80 q- 1 øC. The water phase was then added to the oil phase slowly in a thin stream. A four-blade propeller, which was inserted to a depth of 3.8 cm below the emulsion surface, was used for agitation. The propeller speed was kept constant at 100 rpm. The product was formulated in an air-conditioned labora- tory at 25 q- 1 øC and 40 q- 5% relative humidity. Continuous agita- tion was maintained during air cooling. The experimental emulsions were designed so that at completion each weighed 1000 g. Aliquots of ß Siponic and Siponol are registered trade names of Alcolac Chemical Corp., Baltimore, Md. 21226

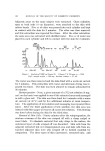
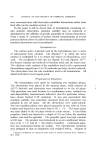
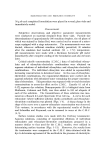
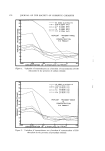
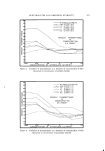
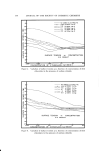
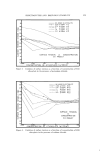
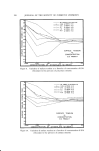
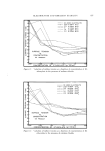
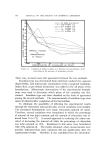
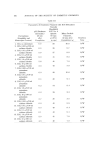
ELECTROLYTES AND EMULSION STABILITY 171 50 g of each completed formulation were placed in several glass vials and immediately sealed. Measurements Subjective observations and objective parameter measurements were conducted on material obtained from these vials. Particle size determinations of approximately 500 emulsion droplets, the oil phase of which was stained by Sudan Red, were carried out by means of a micro- scope equipped with a stage micrometer. The measurements were con- ducted, wherever sufficient emulsion stability permitted, 30 minutes after the emulsion had reached ambient (25 + 1 øC) temperature. pH measurements were made with a Beckman Zeromatic pH meter immediately after complete cooling of the formulation and also 24 hours later. Critical micelle concentration (C.M.C.) data of individual ethoxy- lates and of ethoxylate-electrolyte combinations were obtained on aqueous solutions of individual ethoxylates and ethoxylate-electrolyte combinations. The individual ethoxylate was added in exponentially increasing concentration to deionized water. In the case of ethoxylate- electrolyte combinations, the exponential dilutions were carried out in aqueous solutions with deionized water containing the proper concentra- tion of electrolyte. This procedure was repeated with several electrolyte concentrations to assess the effect on the C.M.C. Exactly 0.1 ml of a 0.5% aqueous dye solution, Benzopurpurin 4B (a biological stain from Matheson, Coleman and Bell), was then added to 100 ml aliquots of each of the solutions. The transmittance of these solutions was mea- sured on a Bausch & Lomb Spectronic 20 at 540 mu. A curve for each ethoxylate (where sufficient solution clarity permitted) and ethoxylate- electrolyte combination was plotted (Figs. 1-4). A sharp change in the slope of the curve over a narrow ethoxylate concentration was observed. This variance, in accordance with the experimental results of Becher and Schmolka and Raymond, can be assumed to occur at the C.M.C. (4, 5). Surface tension studies were made with the DuNouy tensiometer. Aqueous solutions, consisting of exponential dilutions of individua[ ethoxylates and ethoxylate-electrolyte combinations prepared in a manner similar to that used for the C.M.C. studies, were utilized in determining surface tensions (Figs. 5-13). Moreover, the results from the tensiometer were compared to the C.M.C. data obtained with the dye to determine agreement of the methods in the presence of electrolyte.
Purchased for the exclusive use of nofirst nolast (unknown)
From: SCC Media Library & Resource Center (library.scconline.org)