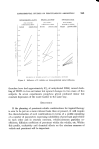
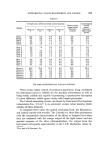
270 JOURNAL OF THE SOCIETY OF COSMETIC CHEMISTS cell which can be rotated, can, however, be fitted to the Colormaster to over- come this difficulty, an average measurement for all orientations being thereby obtained. Tests have been carried out on the Colormaster with rotating accessory, Color-Eye Signature and the Elrepho to establish the reliability with which colour measurements can be reproduced on different types of textile materials. These results are given in Table III. Table III Over-all reproducibility of different instruments on different textile substrates Over-all Reproducibility (1964 C.I.E. Units) Type of fabric Colormaster V with rotating head Indian head cotton Wool flannel Wool slubbing Nylon stocking Cellulose acetate (face side) Cellulose acetate (reverse side) Ceramic tiles 0.31 0.33 1.14 0.37 0.81 0.64 0.10 Color-eye Signature (Large sphere) 0.43 0.44 0.51 0.92 1.01 0.68 0.30 Zeiss Elrepho 0.15 0.35 0.10 The reproducibility is expressed as the mean standard deviation for repeat readings on a number of coloured patterns. A 1964 C.I.E. unit is about 2-13 traces, or just noticeable colour difference steps for textile materials. It is shown by the figures that the instrument reliability is very much dependent on the surface nature of the sample being measured. The more uniform the surface the better is the instrument reliability. For example, the reproducibility of the Colormaster V coloff- meter without rotating accessory on ceramic tiles is as good as 0.1 C.I.E. units. It is therefore necessary, before commencing instrumental colour tolerance work, to establish that the colorimeter selected has a measurement variation on the material to be controlled, which is considerably better than the size of tolerance of interest. COLOUR DIFFERENCE CALCULATION TECHNIQUES Any colour can be specified in terms of three reflectance values X, Y, Z which are related to the way in which that colour is perceived by the

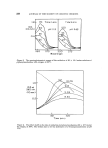
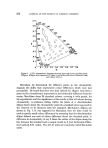
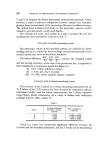
INSTRUMENTAL COLOUR MEASUREMENT AND CONTROL 271 average human observer under particular types of illumination. The values X, Y, Z are called tristimulus values which form the basis of an inter- nationally agreed system known as the ( .I.E. system and may be deter- mined using either a spectrophotometer or a suitable photoelectric tristim- ulus colorimeter. When comparing two colours it is useful to know the relative proportions of X, Y, Z and these are readily obtained from the equations: X X: x+Y+Z Y Y= x+Y+Z z x+Y+Z where x+y+z = 1 It is apparent from the last equation that if x and y are known, z need not be specified, so that a colour can be plotted as a point (x,y) on a graph. The co-ordinates of the point are known as chromaticity co-ordinates. If the chromaticity co-ordinates of the spectral colours, and the non-spectral purples obtained by mixtures of spectral reds and blues are plotted, the locus of points defines the boundary within which all colours must fall. Such a diagram defining this boundary is called the ( .I.E. diagram, and is shown in Fig. 1. The Y value is related to the overall sensitivity of the eye and is taken as a measure of the apparent lightness of a colour. For instance, a white and a black can have the same chromaticity co-ordinates but the white will have a higher lightness (Y value) than the black. In the ( .I.E. system a colour may be completely specified in a three dimensional graph by the quantities x, y, Y where x, y form the ordinate and abscissa in the horizontal plane with Y on the vertical axis. The overall colour difference can be expressed as being made up of two elements: {a) the chromaticity difference which is related to difference in hue and saturation, and {b) the lightness difference. Unfortunately chroma- ticity differences obtained from the chromaticity diagram are not uniformly related to the ability of the eye to discriminate them in different directions and regions of the diagram. In other words, small colour differences which are judged to be visually equal are not necessarily represented by equal chromaticity differences. Similarly, the visual discrimination of small lightness differences varies according to the lightness Y.
Purchased for the exclusive use of nofirst nolast (unknown)
From: SCC Media Library & Resource Center (library.scconline.org)