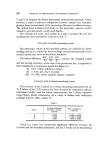
274 JOURNAL OF THE SOCIETY OF COSMETIC CHEMISTS difference. Purchase of such an instrument thereby removes the graphical plotting procedure and speeds up the process considerably. Speed is of con- siderable importance when the number of samples to be assessed is large. An alternative procedure in the calculation of colour differences is the use of a colour difference formula (3). There are many such formulae in existence and it is not clear at present which one gives best correlation with the human eye over all colour space. Four formulae which have been recommended for field trials by the C.I.E. are: The 1964 C.I.E. formula (4), the Cube Root formula (5), the Munsell Renotation formula (6) and the MacAdam-Modified Friele Formula {7). None of these formulae appear to show advantage over the Simon and Goodwin chart method but may be more convenient to use if a digital computer is available. PRACTICAL EXAMPLE OF THE USE OF SIMON AND GOODWIN CHARTS IN THE ASSESSMENT OF PAPER SAMPLES Four standard colours, a red, a grey, a blue and a brown, were assessed visually against a number of similar coloured samples by four experienced colour matchers. The average overall colour differences between each sample and standard were determined from the individual visual assessments. All the patterns were measured on the Zeiss Elrepho colorimeter and Simon and Goodwin charts were used to calculate the instrumental colour differences. Table IV shows a comparison of the figures which includes the individual observer assessments. It is seen from Table IV that quite good agreement is obtained between the instrumental results and the mean visual assessments, bearing in mind the fairly wide spread in the individual observer's assessments. (The overall colour differences are derived from the observers' assessments in terms of differences in strength, shade and brightness.) In view of the variation between assessments of different colour match- ers, patterns passed or failed against an instrumental tolerance will not be judged similarly by everyone. In addition, there is the uncertainty of instrumental measurement which will contribute to a possible erroneous instrumental decision. However, if the instrument reliability is high com- pared with the size of tolerance, and colour matchers agree to accept the instrumental decision, considerably improved accuracy of colour control should result.

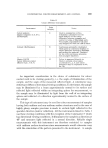
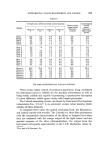
INSTRUMENTAL COLOUR MEASUREMENT AND CONTROL 275 Table IV Overall colour difference from control (traces) [ Instrumencolouroverall Mean overall Sample [ visual colour Observer Observer Observer Observer difference difference 1 2 3 4 (traces) (MacAdam Units) Red 1 12.0 9.4 4.6 6.0 7.6 $.$ Red 2 4.5 2.8 2.4 2.2 2.9 3.0 Red 3 4.1 2.2 2.4 2.2 2.6 3.2 Red 4 2.8 1.4 1.4 1.0 1.6 1.3 Red 5 2.0 1.0 1.4 1.0 1.1 1.2 Grey 1 2.0 1.0 2.4 2.8 1.6 2.0 Grey 2 2.8 -- 1.7 1.4 1.0 1.0 Grey 3 2.0 1.4 2.1 2.8 1.9 1.8 Grey 4 1.0 0.5 1.7 1.5 1.1 1.6 Grey 5 1.0 0.5 1.7 2.0 1.2 0.9 Grey 6 1.0 0.5 1.7 2.8 1.4 1.3 Blue 1 9.8 4.5 4.9 6.0 6.1 8.0 Blue 2 6.9 4.9 6.7 6.0 5.9 8.6 Blue 3 8.2 4.9 6.7 6.0 6.3 7.9 Blue 4 9.4 5.4 6.7 6.0 6.6 8.4 Brown 1 60.5 25.6 16.3 $.9 27.0 24.5 Brown 2 25.3 $.2 4.2 2.8 9.7 5.7 Brown 3 8.0 4.0 4.2 2.0 5.0 3.1 Brown 4 4.0 2.8 2.7 2.8 2.8 4.1 Brown 5 2.8 2.2 2.2 2.5 2.3 3.5 Brown 6 2.0 [ 2.0 2.4 2.0 2.0 0.9 ON-LINE INSTRUMENTAL COLOUR CONTROL When on-line colour control of continuous material is being considered the instrument must be suitable for the machine environment as Well as being stable, reliable and capable of producing a quantitative description of colour difference, which agrees closely with human perception. The Colorere measuring system, developed by Instrument Development Laboratories Inc., U.S.A.*, is an automatic on-line colour monitor which satisfies all these demands. It comprises three units: the optical measuring head, the illuminator, and control console with recorder. The Colored• is a three filter photometer with the transmission characteristics of the filters so designed that when they are combined with the energy output of the light source and the spectral response of the three photomultipliers, the output from the instrument corresponds approximately to the C.I.E. tristimulus values X, , *Now part of Kollmorgen, Inc.
Purchased for the exclusive use of nofirst nolast (unknown)
From: SCC Media Library & Resource Center (library.scconline.org)