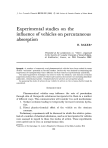
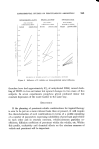
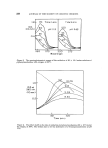
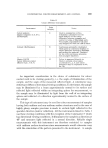
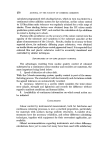
272 JOURNAL OF THE SOCIETY OF COSMETIC CHEMISTS 0.9 0'8 0.7 0.6 0'5 0.4 0.3 0'• 0.1 Figure 1. C.I.E. chromaticity diagram showing Spectrum Locus and MacAdam Ellipses. (Ellipse sizes represent 10 times a just noticeable colour difference from each ellipse centre.) MacAdam (1) determined for different points in the chromaticity diagram the shifts that represented colour differences which were just perceptible. He found that they were best defined by ellipses such that a point on the circumference represented a just noticeable difference from the centre. MacAdam chose 25 standard colours, covering a wide gamut, for his experiments and the significance of his results is that all colours having chromaticity co-ordinates falling within the limits of a discrimination ellipse drawn about the chromaticity point of a standard colour appeared to the observer to be identical with the standard. MacAdam's ellipses are shown in Fig. 1. It was suggested by MacAdam that his data could be used to specify small colour differences by assuming that the discrimination ellipse defined one unit of colour difference about the standard point. A difference in chromaticity of say 3 times the radius of the ellipse along the line between the standard and a sample would be 3 Just Noticeable Differ- ence units (J.N.D. units). The J.N.D. units are commonly called MacAdam units.

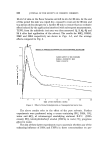
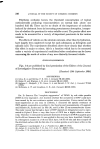
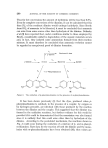
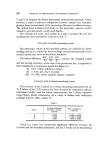
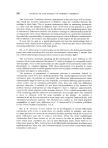
INSTRUMENTAL COLOUR MEASUREMENT AND CONTROL 273 A convenient graphical method for colour difference determination was devised by Simon and Goodwin (2) and is based on MacAdam's data. They proposed that 89 ellipses covering defined regions of the C.I.E. diagram were sufficient for colour difference work and prepared special charts which transformed the C.I.E. diagram such that the discrimination limits plotted as circles of equal radius. A further set of 13 charts was prepared to enable chromaticity differences to be corrected for lightness and to enable lightness differences to be expressed in J.N.D. units. When a sample, or series of samples, is to be assessed against a control, a colorimeter measurement is made on each pattern. X, Y, Z values for the control and the samples, obtained either directly from the colorimeter or by conversion of instrument readings, are recorded and the chromaticity co- ordinates (x.y) are calculated. The appropriate Simon and Goodwin chromaticity chart is selected and the chromaticity points are plotted. A direct measure of the chromaticity difference between sample and control is obtained from the distance between the chromaticity points. This distance is measured and its value recorded on the appropriate chart from the second set of 13. The lightness or Y values are recorded also and three quantities the lightness difference, the chromaticity difference and the overall colour difference which includes both the lightness and chromaticity differences, are displayed. A tolerance limit such as is shown by the semi-circle in Fig. • may be superimposed indicating that the sample plotted is outside tolerance. DARKER Figure 2. CHROMATICITY DIFFERENCE /• SAMPLE / / LENGTH EQUALS OVERALL "-'•""•/•/CO L 0 IJ R DIFFERENCE // TOLERANCE LIMIT / • LIGHTER COI'ITROL L iGHTI'!E$S DIFFERENCE Simon and Goodwin colour difference calculating chart The Colour Analysis Display Computer uses the MacAdam ellipse data and when fed with colorimeter readings automatically displays colour
Purchased for the exclusive use of nofirst nolast (unknown)
From: SCC Media Library & Resource Center (library.scconline.org)