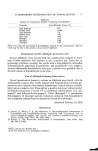
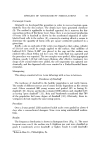
FLUOROMETRIC DETERMINATION OF FORMALDEHYDE 69 the exciting wavelength and 510 nm for the emitting wavelength (these wave- lengths may vary with other instruments) with the following slit arrange- ment: 4-mm slits in the path o{ the fluorescent light 1-mm slits in the posi- tions on the opposite side of the cuvette from the light path. The dilution of the reacted sample solution necessary to obtain fluorescence intensity readings within those of the standards is determined. Another sam- ple solution of the proper dilution is prepared and the condensation reac- tion repeated. The fluorescence intensity of the standards is plotted on the per cent scale vs. the concentration in/zg/ml of formaldehyde (Fig. 2). The curve for the standards is linear. The concentration of the sample can be determined by comparing its fluorescence intensity with the standard curve. 8O • 7o z 60 r- 5o • 40 n- 30 2O CONCENT•AT[ON, •g/m[ Figure 2. Fluorescence intensity as per cent transmittance rs. concentration in tzg/ml of formaldehyde ]•ESULTS AND DISCUSSION Formaldehyde was determined by the fluorescence method on a numbcr of shampoos not containing formaldehyde to which 1.00 mg of formaldehyde had been added by pipette. Recoveries, shown in Table I, ranged from 93 to 103%. Formaldehyde was added to other cosmetic products in which it is some- times used as a preservative but which did not contain formaldehyde initially. Recoveries of formaldehyde by the fluorescence method varied more than those for the shampoos however, they were still good (Table II). Several commercial cosmetics containing formaldehyde have been analyzed by the method with the results in Table III.

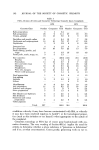
70 JOURNAL OF THE SOCIETY OF COSMETIC CHEMISTS Shampoo Table I Recoveries of Formaldehyde Added to Shampoos (1 mg Added) Formaldehyde Sample (g) Found (mg) Recovery (%) i 0.1064 0.98 98 2 0.1043 0.93 93 3 0.1029 1.03 103 4 0.1283 0.95 95 5 0.1028 1.00 100 6 0.1385 0.95 95 7 0.1122 1.00 100 8 • 0.1398 0.98 98 9 • 0.1568 0.90 90 Av. 0.97 97 Std. Dev. 0.04% •*Protein shampoos. Table II Recoveries of Formaldehyde Added to Cosmetic Products (1 mg Added) • Formaldehyde Cosmetic Product Sample (g) Found (mg) Recovery (%) Bath oil A 0.2297 0.89 89 Bath oil A 0.1102 1.10 110 Bath oil A 0.1337 0.96 96 Hair conditioner A 0.1482 0.82 82 }lair conditioner A 0.2703 1.00 100 Hair conditioner A 0.1926 0.90 90 Hair conditioner B 0.2568 0.82 82 Hair conditioner C 0.1931 0.93 93 Hair groom 0.1333 1.04 104 Hand lotion A 0.1700 0.76 76 Hand lotion B 0.1615 0.97 97 Hand and body lotion C 0.1340 1.10 110 Hand and body lotion C 0.1359 0.96 96 Skin cream 0.1087 1.08 108 Hand cream 0.11182 1.06 106 Body cream 0.2033 1.00 100 •'Bath oil A: standard deviation 0.11%. Hair conditioner A: standard deviation 0.09%. Hand and body lotion: standard deviation 0.10% The stability of formaldehyde in shampoos was determined by adding dif- ferent amounts to several shampoos, allowing them to remain several days, and determining the formaldehyde concentration by the fluorescence meth- od. The results indicate a slight decrease in the concentration over a period of several days. The tested shampoos did not contain any materials which reacted rapidly with the formaldehyde and in such media the formaldehyde is relatively stable.
Purchased for the exclusive use of nofirst nolast (unknown)
From: SCC Media Library & Resource Center (library.scconline.org)