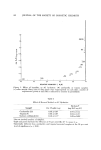
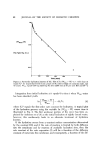
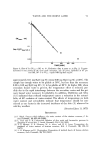
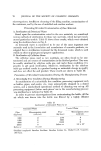
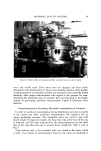
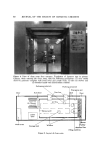
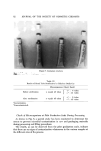
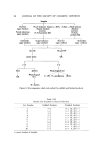
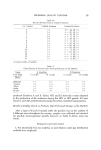
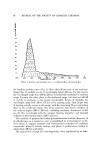
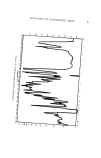
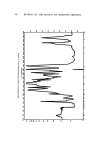
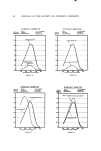
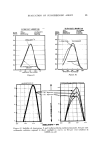
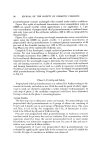
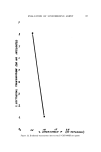
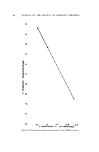
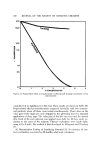
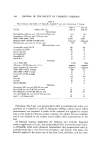
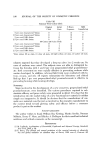
WATER AND THE HORNY LAYER 65 and hydrated weights were again recorded. Effects of aqueous exposure were studied by immersing 8 mm punches of SC in distilled water for specified lengths of time. Each of 5 punches from a single piece of SC was immersed for 0, 1, 3, 10, or 24 hours. Following immer- sion, dry weights and water uptakes (97 per cent BH and 30øC for 48 hours) were recorded as described previously. Three sets of 5 were run, using the following 3 SC specimens: trypsin, cantharidin, and sunburn. Results The relationship between hydration of SC and BH or activity of water is shown in Fig. i for cantharidin blister and trypsin samples. Average dry weights and equilibrium hydrations for samples harvested by all three meth- ods are shown in Table I with statistical significance determined by analysis of variance and F-ratio test. Effects of exposure to water and to heat at 60øC are shown in Tables II and IH. The effect of temperature on the equilibrium water content at various re]a- five humidities has been discussed in detail by Spencer et al (3). The ability of the SC to retain water at equilibrium in vitro decreases with decreasing temperature at humidities be]ow 60 per cent. Above 60 per cent BH, this temperature dependence decreases with increasing BH until there is essen- tially no temperature effect on the equilibrium water content above 90 per cent. Kinetics of hydration of the SC from a dry weight to a steady state (SS) water content at 97 per cent BH were recorded for more than 45 samples. Analysis of hydration can be accomplished by treating the system as either diffusion of vapor into a membrane or pseudo-first order reaction of wate• with the membrane. Analysis of SC hydration as a diffusion problem can be defined as the sorp- tion of vapor by a plane sheet. Using an approximation for determining the average diffusion coefficient D from initial sorption data as described by described by Crank (6) and Scheuplein (7), one obtains the equation Wma. - 4 (*) where W equals mg H20/mg SC at time t after the dry sample has been placed in the hydration chamber Wmax equals the SS water weight (mg H20/mg SC) at 48 hours, • equals the average diffusion coefficient for the hydration t equals time (in minutes) and 1 is one-half the thickness of the SC. A plot of W/W,•ax versus t u will yield-• from the slope (m) squared as m 2 X -- 16.

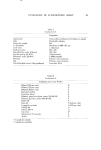
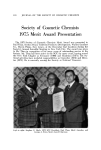
66 JOURNAL OF THE SOCIETY OF COSMETIC CHEMISTS 1.0 ..• o.$ E 0 :• o6 E O4 0.2 o .(6} 0.0 (3)(3). (7) ß ß (5) :(7} .(7) :{7) x :(71 x :(s) i(s) I I I I I i I 0.2 0.4 0 6 0.$ 1.0 RELATIVE HUMIDITY ( H20) Figure 1. Effect m c humidity on SC hydration: (o) cantharidin or trypsin samples (x) callus sample. Since most of data points were superimposed on each other, number experimental points at each RIt is indicated by number in parentheses Table I Effect of Harvest Method on SC Hydration Hydrated b Sample a Dry Weight (rag) (mg H./mg SC) Cantharidin (23) 0.48 q- 0.07 0.77 _ 0.14 Trypsin (9) 0.50 _--*- 0.07 0.84 _--*- 0.17 Sunburn exfoliated (11) 0.38 q- 0.17 • 1.08 q- 0.08 c "liarvest method (number of samples). •'Eight mm punch hydrated for 48 hours at 97 per cent RH, 30 ø C, mean q- "Statistically different from cantharidin and trypsin harvested samples at the 99 per cent level of significance (a • 0.01).
Purchased for the exclusive use of nofirst nolast (unknown)
From: SCC Media Library & Resource Center (library.scconline.org)