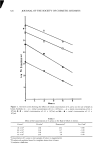
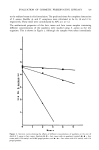
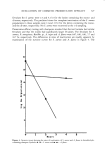
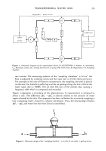
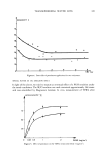
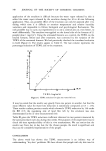
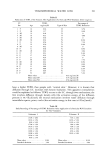
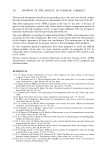
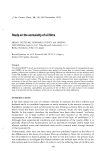
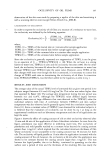
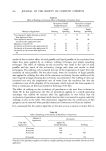
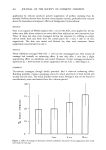
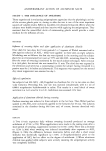
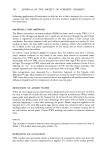
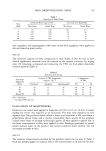
340 JOURNAL OF THE SOCIETY OF COSMETIC CHEMISTS application of the emulsion is difficult because the water vapor released by skin is added the water vapor released by the emulsion during the 30 to 40 min following application. Thus, any possible effect of the emulsion can only be assessed after 1 hr, during which time it is difficult to monitor temperature and relative humidity variations and impossible to follow biological and psychological fluctuations. The only possible way to carry out experiments is to use a control area or, even better, to work differentially. The emulsion was applied on the dorsal side of the forearm of 21 people (dose 1 mg/cm2). Using the untreated forearm as a control, the TEWL on the treated forearm, before and after treatment, was corrected by the variation of the TEWL of the untreated forearm. We had previously checked the correlated evolution in both (Figure 6). The results appear in Table II. The last column represents the percentage reduction of TEWL due to the treatment. (L.A) 0,8 ./ •- (R.A) 018 I I • I I : • I 1,2 1,4 T.E.W.L. (mg/em•. h) Figure 6. TEWL evolution for right arm versus left arm. It may be noted that the results vary greatly from one person to another, but that the mean efficient value for water loss reduction is statistically computed as 6.5 _+ 2.5%. These results confirm previous results which showed a TEWL reduction by 15% under 0% RH (17) the regulating role of lipid film left by the emulsion was also demonstrated in the in vitro measurements (18). Table III gives the TEWL reduction coefficient obtained on two persons measured by the same procedure each day during two weeks. The purpose of this experiment was to check the time reproductibility of this in vivo measurement. We can notice that the results vary from day to day but, for the chosen people, the result is significant and thus can be considered representative of the people. CONCLUSION The above work has shown that TEWL measurement is an indirect way of understanding "dry skin" problems. We have shown that people with dry skin tend to

TRANSEPIDERMAL WATER LOSS 341 Table II Reduction of TEWL of the Forearm After Application of a Particular W/O Emulsion. Dose: lmg/cm2 N ø TEWL Percentage of Sex Age mg/cm2/H Type of Skin TEWL Reduction 1 F 41 0.63 D 9.7% 2 F 44 1.17 D 8.4% 3 M 33 O.44 N 0 4 M 35 0.52 N 4.0% 5 M 26 0.56 D 0 6 M 39 0.63 N 10.3% 7 F 32 0.56 N 7.1% 8 F 25 0.59 N 11.9% 9 M 32 0.42 N 0 10 F 31 0.(• N 14.5% 11 M 29 0.63 N 3.9% 12 F 27 0.53 N 11.4% 13 F 27 0.36 N 3.7% 14 F 21 0.36 N 0 15 F 40 0.63 N 7.7% 16 M 28 0.63 D 13.5% 17 M 28 0.50 N 8.9% 18 F 21 0.80 N 5.0% 19 F 35 0.88 D 12.3% 20 F 47 0.49 N 9.1% 21 F 54 0.87 D 5.2% Mean value ................................ 0.61 mg/cm2/H Mean value DS ............................. 0.75 mg/cm2/H Mean value NS ............................... 0.54 mg/cm2/H have a higher TEWL than people with "normal skin." However, it is known that diffusion through S.C. increases with keratin hydration. This apparent contradiction could be explained as follows: TEWL occurs in the S.C. through two mechanisms the first involves diffusion through keratin cells (the activation energy of the diffusion process is 19.7 Kcal/mol) the second mechanis•n involves water diffusion through intercellular spaces, pores, cracks (the activation energy in this case is 6 Kcal/mole). Table III Daily Recording of Percentage of TEWL Reduction After Application of a Particular W/O Emulsion for Two Volunteers. Volunteer I Volunteer II 15.0% 4- 4.0% 7.5% + 2.0% 10.3% + 3.5% 14.5% + 5.2% 8.6% 4- 1.6% 13.5% + 3.1% 17.0% + 1.5% 2.8% + 2.8% 10.3% 4- 4.2% 7.9% + 1.2% 15.1% ñ 1.4% 9.7% 4- 5.2% 16.8% 4- 1.3% 6.5% 4- 2.0% 10.O% + 3.6% 20.2% 4- 1.8% 16.6% + 1.1% 8.4% ñ 2.7% Mean value ...................... 12.8% Standard deviation ............... 3.4% Mean value ...................... •0.3% Standard deviation ............... 4.4%
Purchased for the exclusive use of nofirst nolast (unknown)
From: SCC Media Library & Resource Center (library.scconline.org)