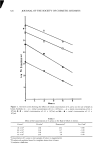
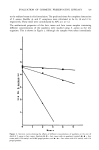
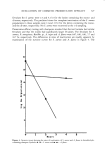
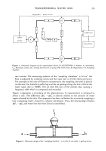
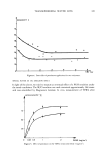
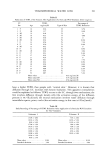
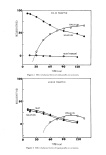
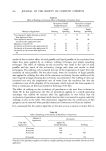
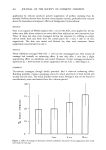
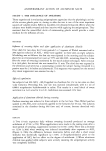
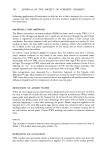
EVALUATION OF COSMETIC PRESERVATIVE EFFICACY 323 This procedure was repeated for additional test organisms, except that PDA was used as the plating medium for molds. The test materials were resampled at various times after inoculation--typically at 2, 4 and 24 hr for bacteria and at 4, 8 and 24 hr for molds. The Petri dishes containing the test bacteria were incubated for 48 hr at 35øC and the Petri dishes containing the test molds were incubated for 7 d at 25øC. Additional samples were taken at 3, 5, or 7 d after inoculation unless the previous aerobic plate count (APC) was 10/ml. The APC determined immediately after inoculation was used as the zero time count. The zero time counts varied from the number of organisms predicted from the APC of the saline suspension of the test organism to none detected, depending on the rate of inactivation of the organism in the test sample. The decimal reduction time (D-value) for each organism in each test sample was calculated by taking the negative reciprocal of the slope of the line obtained by linear regression of the plot of the log number of surviving organisms as a function of the time after inoculation into the test sample. The time predicted for complete destruction of each test organism in a product was calculated by linear estimate of the X-intercept, which was defined as the time required for the number of surviving organisms to decrease to 1/ml (i.e., where the log 1 = 0). The correlation coefficient was calculated to establish how well the data fit the linear regression. All analyses that gave a correlation coefficient that was outside of the 95% confidence limits (i.e., _+ 2 standard deviations), about the running average of this parameter, were rejected. The accuracy of the linear regression method was determined by comparing the times predicted for complete destruction of the test organisms with the actual times observed to find 10/ml on analysis of the samples taken on day 1, 3, 5 or 7. The effect of the concentration of bacteria in the test sample on their rate of inactivation was determined by inoculating different concentrations of S. aureus in saline into separate lotion samples and determining the D-value for each sample. The effect of culture medium on the rate of bacterial inactivation in lotion was determined by comparing the rates of inactivation of S. aureus in lotion and in lotion containing 4% (vol/vol) Brain Heart Infusion (BHI) broth (Difco Laboratories). The D-values were determined for both samples RESULTS The effect of different concentrations of S. aureus in the lotion on the rate of die-off is illustrated in Figure 1. The rate of inactivation of this organism was similar for 1.5 x 10 3 tO 1.8 X 10 6 S. aureus/ml lotion. The initial concentration of S. aureus in each sample, the D-value, the predicted time for complete destruction of the organisms, and the correlation coefficient are given for each concentration of $. aureus used (Table 1). The D-values ranged from 2.04 to 2.86 hr, with a mean value of 2.47 hr. The predicted times for complete destruction of the challenge organisms decreased with decreasing initial microbial load in the test samples. The correlation coefficients ranged from -0.98 to --1.00, and this demonstrates that there was a good fit of the APC at different times with the linear regression. The D-values for S. aureus, Bacillus sp. and P. aeruginosa in face cream were 18, 5.7 and 1.2 hr, respectively. This shows that different organisms have different susceptibilities

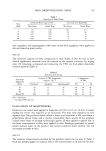
324 JOURNAL OF THE SOCIETY OF COSMETIC CHEMISTS • 31 6 ' ' t i 2 Hours Figure 1. Survivor curves showing the effects of initial concentration of S. aureus on the rate of death in lotion. Symbols: 0----0 = initial concentration of 1.8 x 10⁶/ml, []----[] = initial concentration of 4.6 x 10⁵/ml, e--e = initial concentration of 4.5 x 10⁴/ml, and I----I = initial concentration of 1.5 x 10³/ml. Table I Effect of the Concentration of S. aureus on the Rate of Death in Lotion. Concn. a D-value b Destruction b Cor. Coef. c 1.8 x 10⁶ 2.86 18.4 -0.98 4.6 x 10⁵ 2.38 13.7 - 1.00 4.5 x 10⁴ 2.04 9.6 -0.99 1.5 X 10³ 2.45 7.8 --1.00 aConcentration of $. aureus in test samples of lotion in organisms/mi. bD-values and predicted times for complete destruction in hours. CCorrelation coefficient.
Purchased for the exclusive use of nofirst nolast (unknown)
From: SCC Media Library & Resource Center (library.scconline.org)