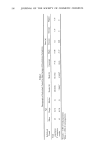
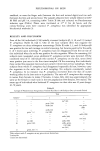
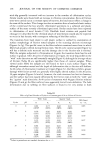
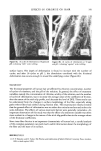
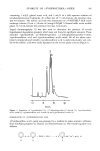
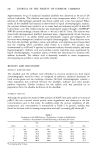
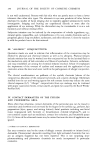
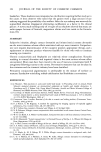
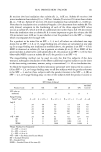
234 JOURNAL OF THE SOCIETY OF COSMETIC CHEMISTS from each friction test direction and treatment. Each sample was mounted in the same direction onto the specimen holder using double-coated adhesive tape. The specimens were sputter-coated with gold/palladium to an approximate thickness of 500•. All specimens were viewed on an Etec Autoscan © using an accelerating voltage of 20 kV and a 45 ø tilt angle with the tip of the fiber pointing towards the source of the electron beam. RESULTS AND DISCUSSION Effect of Chlorine Concentration and Number of Cycles of Treatment The effects of chlorine concentration and the number of 1-hour cycles of treatment on average values of frictional parameters are shown in Table II. Also included in this table are the values of standard deviations for each data set. Some of these results are illustrated in Figure 3. The results show that the first increment in chlorine concentration (from 0 to 10 ppm) gives increases in the values of the coefficients of friction in both the static and the kinetic modes as well as in both the "with" and the "against" scale directions these increases in values of 3t are statistically significant at 99% level for all three cycles of treatments. Further increase in concentration (from 10 to 50 ppm), however, does not produce further significant change. The effect of the Table II Effect of Chlorine Concentration and Number of Cycles at a Constant pH of 8.0 on Values of Friction "With" Scale "Against" Scale DFE (Static) CycLes ppm •, •k •, 3tk •a -- •w 0* 0 10 50 20 0 10 50 4O 0 10 50 6O 0 10 50 0.181 (.0124• 0.226 (.o251) 0.197 (.0157) 0.309 (.0244) 0.341 (.0341) 0.237 (.0271) 0.339 (.0238) 0.352 (.0231 0.243 (.0066 0.332 (.0557 0.347 (.0129 0.175 0.246 (.0123) (.0076 0.226 0.283 (.0251) (.0223) 0.197 0.285 (.0157) (.0190) 0.309 0.352 (.0238) (.0172 0.337 0.357 (.0315) (.0076 0.237 0.331 (.0271) (.0451 0.335 0.378 (.0224) (.0288) 0.343 0.382 (.0228) (.0386) 0.243 0.338 (.0O66) (.0244) 0.322 0.364 (.0468) (.0346) 0.334 0.366 (.0093) (.0136) 0.226 0.O65 (.c•5o) 0.283 0.057 (.0226) 0.284 0.088 (.0184) 0.347 0.043 (.o155) 0.346 0.016 (.o112) 0.330 0.094 (.0429) 0.374 0.039 (.0319) 0.364 0.030 (.0274) 0.334 0.095 (.0222) 0.352 0.032 (.0291) 0.353 0.019 (.0144) *The 0 cycle, 0 ppm, values were obtained on a tress soaked in water for five minutes and then dried. '•Values in parentheses are standard deviations for n = 5.

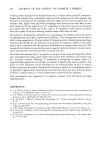
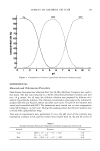
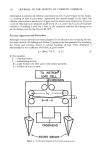
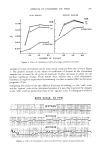
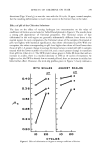
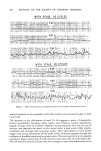
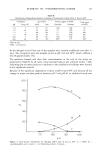
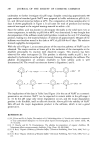
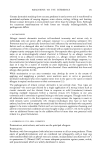
EFFECTS OF CHLORINE ON HAIR 235 WITH SCALES AGAINST SCALES PPM 0.:36 50 io 0.:32 0.28 0.24 - 0 (CONTROL) 0.20 I I I I I 20 40 60 20 40 NUMBER OF CYCLES Figure 3. Effect of chlorination at pH 8 on average coefficient of friction. PPM ., - I0 ONTROL) I 60 number of cycles of treatment can be more clearly examined from the curves in Figure 3. The greatest increase in the values of coefiqcient of friction of the chlorinated samples has occurred by 20 cycles of treatment. Further increases in cycles do not produce significant change. These results, thus, indicate that a mild chlorination treatment, as might be experienced in swimming, can have a marked effect on frictional properties of hair. Comparing the results of the two different directions of rubbing, i.e., the "with" scale and the "against" scale of the chlorinated samples, it is seen that in general the changes in the "with" scale are greater than those in the "against" scale. A consequence of this is WITH SCALE, 10 PPM Figure 4. Effect of chlorination at pH 8 on Instron © force pattern during friction tests.
Purchased for the exclusive use of nofirst nolast (unknown)
From: SCC Media Library & Resource Center (library.scconline.org)