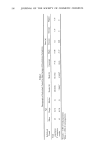
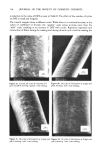
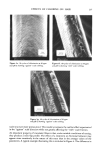
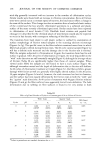
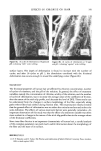
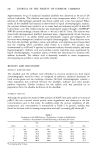
238 JOURNAL OF THE SOCIETY OF COSMETIC CHEMISTS stick-slip generally increased with an increase in the number of chlorination cycles. Similar results were found with an increase in chlorine concentration. Since all friction tests were carried out at a constant speed of traverse, the load traces reflect a change in the state of the surface. This change involves a transition from a hard and elastic surface of the control and the less severely chlorinated specimens to a softened and plastic surface of the more severely chlorinated specimens. Similar results have been reported in chlorination of wool keratin (7-10). Disulfide bond scission and peptide link cleavage (11) described for the chemical attack of wool keratin would also be expected to occur in hair keratin, with consequent softening of the fiber surface. The transition from hard elastic to soft plastic surface is verified by examination of surface morphology of friction tested samples in the scanning electron microscope (Figures 5a-5g). The specific areas on the fiber surfaces examined were those in which fibers had actually rubbed during friction tests. The 60 cycle control sample (Figure 5a) still has a definite scale structure and the damage due to the friction test is minimal. With the samples subjected to chlorination at 10 ppm, the transition from hard to soft surface is gradual. After 20 cycles of chlorination at 10 ppm, the stick-slip profiles in the "with" scale direction are still essentially straight (Figure 4), although the average values of friction (Table II) are significantly higher than those of control samples. When viewed under SEM, the samples are still found to have a scaly surface (Figure 5b), although somewhat muted and the depth of deformation due to friction still shallow. At 60 cycles of chlorination treatment at 10 ppm (Figure 5c), the fibers exhibit a greater damage with friction as well as a generally more highly altered surface. In the 20 cycles, 50 ppm samples (Figures 5d and e), however, the scale structure has lost its character, and the surface has been equally deformed by the friction tests in both the "with" and the "against" scale directions. At 60 cycles of treatment with 50 ppm chlorine solution (Figures 5f and g), the fiber surfaces have apparently lost all scale definition. The bulk deformation due to rubbing on fiber surfaces is found to be very similar in both Table III Effect of pH and Number of Cycles at a Constant ppm of 50 on Values of Friction "With" Scale "Against" Scale DFE (Static) Cycles pH 3t, 3tk 3rs 3tk 3ta - 3tw 10 20 8 0.181 0.175 0.246 0.226 0.065 (.0124)* (.0123) (.0076) (.0050) 8 0.226 0.226 0.283 0.283 0.057 (.0251) (.0251) (.0223) (.0226) 4 0.336 0.336 0.375 0.367 0.039 (.0166) (.0170) (.0231) (.0113) 2 0.374 0.359 0.401 0.374 0.027 (.0171) (.0119) (.0278) (.0062) 8 0.341 0.337 0.357 0.346 0.016 (.0341) (.0315) (.0076) (.0112) 4 0.360 0.358 0.390 0.386 0.030 (.0188) (.0187) (.0202) (.0186) 2 0.399 0.367 0.409 0.358 0.010 (.0197) (.0069) (.0385) (.0196) *Values in parentheses are standard deviations for n = 5.

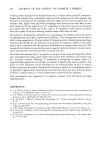
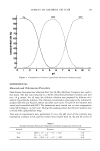
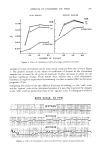
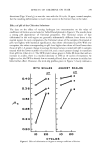
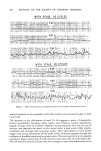
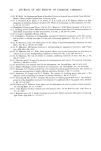
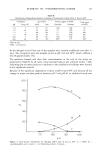
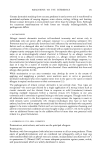
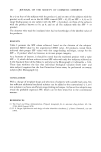
EFFECTS OF CHLORINE ON HAIR 239 directions (Figs. 5f and g), as was the case with the 20 cycle, 50 ppm, treated samples, but the resulting deformation is much more severe in the former than in the latter. Effect of pH of the Chlorine Solutions The data on the effect of varying hydrogen ion concentration on the value of coefficient of friction are included in Table III and plotted in Figure 6. The results show a strong pH dependence of frictional properties. The frictional values of hair chlorinated in the acid region are generally substantially different from those in the neutral region. In every comparison, the frictional values of the samples chlorinated at pH 2 are higher, with statistical significance, than those chlorinated at pH 8. With one exception, the values corresponding to pH 4 are higher than those of 8 and lower than those of pH 2. A greater change in average frictional values is noted with pH in samples treated with the lower number of cycles (10), and a much greater change in transition from pH 8 to 4 than 4 to 2. The DFE (static) values given in Table III show that with an increase in acidity, there is a marked decrease in DFE at 10 cycles of treatment. At higher cycles, the DFE is already low at neutral pH and, thus, an increase in acidity has little further effect. However, the stick-slip profiles given in Figure 7 clearly indicate a WITH SCALES AGAINST SCALES pH 0.40 0.32 0.28 0.24 - 2 0.'0 I pH I I I I IO 2o IO 2o CYCLES Figure 6. Effect of chlorination at 50 ppm on average coefficient of friction.
Purchased for the exclusive use of nofirst nolast (unknown)
From: SCC Media Library & Resource Center (library.scconline.org)