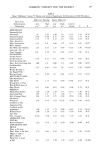
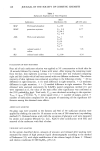
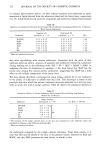
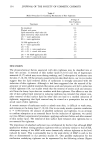
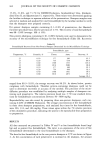
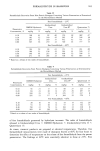
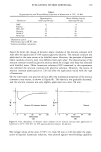
COSMETIC THERAPY FOR THE ELDERLY 137 Table I Mean "Difference" Scores,* F Ratios, and Levels of Significance for Dimensions of Self-Perception Make-over Training Passive Make-over Short-term Self-perception Low High Low High Control Dimensions p.a. a p.a. p.a. p.a. Group F P APPEARANCE Presentable/Not Presentable 1.0 0.25 1.88 1.0 - 0.12 1.43 N.S. b Natural/Artificial 0.38 - 0.50 0.25 - 1.37 0.13 1.31 N.S. Glamorous/Drab 2.13 1.75 2.13 1.0 0.50 2.25 N.S. Phys. Attractive/ Phys. Unattractive 2.13 2.0 1.88 1.25 0.13 2.65 0.05 Well, Healthy/ Not Well, Not Healthy 1.25 0.13 2.13 0.50 -0.25 3.46 0.025 Age Look. (No. of Years Younger) 11.0 5.25 5.0 0.63 -0.37 1.96 N.S. SOCIALIZING Socially Secure/ Socially Insecure 0.75 0.13 1.0 0.50 - 0.75 1.81 N.S. Feel Like Going Out/ Don't Feel Like Going Out 1.88 1.0 2.88 1.13 0.03 2.88 0.05 Confident/Shy, Reticent 1.75 0.63 1.63 1.0 - 0.12 3.29 0.025 Would Be Glad to See People/Prefer Not See People 2.13 0.38 1.0 0.63 - 0.75 3.03 0.05 ATTITUDE TO SELF Like Myself/Don't Like Myself 1.0 1.13 1.63 0.50 - 0.02 2.01 N.S. Strong Sense of Own Worth/Weak Sense of Own Worth 0.13 0.63 0.63 0.38 0.38 0.15 N.S. FEELINGS Pleased/Not Pleased 1.38 1.38 1.38 1.13 - 0.12 1.58 N.S. Interesting/Dull 1.63 1.5 1.5 1.38 0 1.89 N.S. Full of Energy/Tired 1.63 1.25 2.25 0.38 0.50 2.36 N.S. Optimistic/ Pessimistic 1.63 0.75 1.63 -0.25 0.38 2.96 0.05 Confident in My Appearance/Not Confident in My Appearance 1.88 1.25 1.75 0.88 - 0.87 3.14 0.05 Relaxed/Tense 1.88 1.50 1.33 0.63 0.50 0.94 N.S. Age: Feel (Yrs. Younger) 10.50 5.50 5.63 4.63 - 1.25 1.62 N.S. HOPES FOR THE FUTURE Positive/Negative 1.25 0.75 1.25 0.50 0.88 0.60 N.S. APPEARANCE SELF IMAGE Want to Be Seen/ Don't Want to Be Seen 1.75 0.63 2.63 1.13 0.0 2.81 0.05 Happy to Look at Self in Mirror/ Prefer Not to Look at Self 2.0 1.25 2.50 1.50 -0.87 6.48 0.001

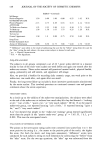
138 JOURNAL OF THE SOCIETY OF COSMETIC CHEMISTS Table I--(Continued) Self-Image: Positive/Negative 1.50 0.88 1.88 0.88 0.25 1.62 N.S. OUTLOOK ON LIFE Positive/Negative 2.13 0.75 0.38 0.63 0.13 4.14 0.01 ATTITUDE To Make-over Sessions 1.25 2.25 2.88 3.13 0.38 5.73 0.01 To Make-up 1.38 1.58 1.63 1.75 0.25 1.29 N.S. MOTIVATION To Care for General Appearance 1.38 1.0 0.88 0.75 0.50 0.69 N.S. Long-Term Overall Summated Score Across 22 Dimensions 9.88 8.50 12.75 5.86 -4.00 2.76 0.05 * "Difference" score refers to the result of subtracting the score for the "before" rating from the score for the "after" rating for each subject the mean across subjects is shown for each scale. a p.a. = Physical Attractiveness. b N.S. = Not Significant. Long-term assessment The subjects in all groups completed a set of 22 7-point scales (derived in a manner similar to that of the short-term scales) one week before and again one month after the make-over session. These scales assessed self-perceived mental health, physical health, aging, personality and self esteem, and appearance self-image. Also, we provided a booklet for recording daily cosmetic usage, one week prior to the make-over, one week after, and again after one month. Finally, the long-term follow-up included a short interview questionnaire administered by the senior author. This involved questions on continued cosmetic care and general comments about the entire experience. TREATMENT CHECK As a check up on the validity of the make-over manipulations, the subjects were asked at the end of the make-over to indicate how much they felt they had learned--"nothing at all," "just a little," "quite a lot," or "very much indeed." Of the 16 in the passive make-over group, one reported learning "just a little," 11 reported learning "quite a lot," and 5 "very much indeed." A X 2 test showed that people in the "make-over training" group learned significantly more than the people in the "passive make-over" group, X 2 = 1161.55, 1 d.f., p 0.001. This was the anticipated result. EVALUATION OF DIFFERENCE SCORES The points on the seven-point rating scales were converted into scores from 1 to 7 the more positive the rating (i.e., the nearer to the positive pole of the scale), the higher the score. For both the short- and long-term assessment, "difference" scores were calculated for each subject's rating on each dimension by subtracting the "before" from the "after" score. For the two age questions, the "after" age was subtracted from the
Purchased for the exclusive use of nofirst nolast (unknown)
From: SCC Media Library & Resource Center (library.scconline.org)