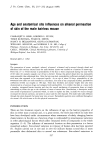
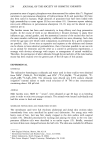
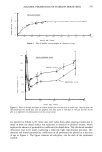
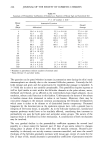
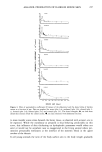
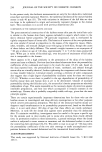
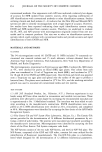
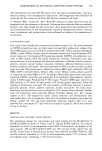
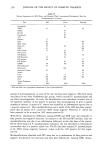
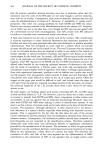
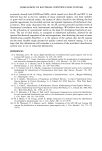
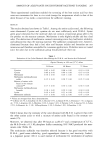
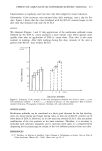
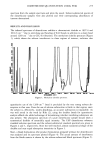
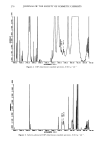
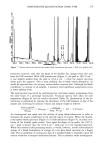
DIMETHICONE QUANTITATION USING FTIR 277 .•r,•).o • o •.mo.o zeoo.o z2zm.o •oo.o •oo.o 1soo o •nnn.o •em.nn 'too nn ,•,.nn .mo.nn Figure 4. Blank formulation spectrum. 4F:•O. O 4000. O •4OD.O Z•(]O. O 2•0. O 1•]O.O IGOO.O 1•1)O,O 1000 .O I}SD .nn •I ]O. nn 5•). nn 4oo.nn • (l•rl.-I 1 Figure 5. Solvent-subtracted blank formulation spectrum.

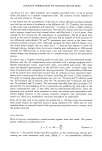
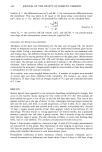
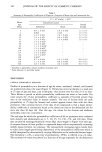
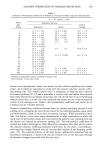
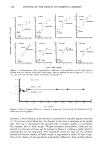
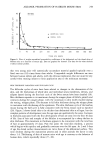
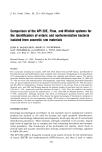
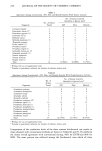
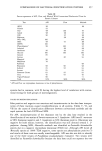
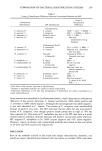
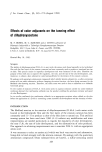
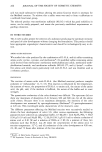
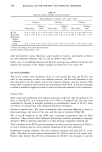
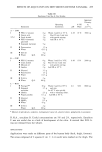
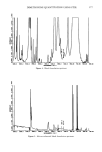
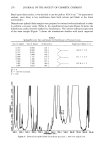
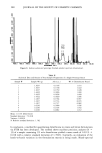
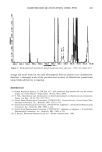
278 JOURNAL OF THE SOCIETY OF COSMETIC CHEMISTS Based upon these results, it was decided to use the peak at 1014.6 cm- • for quantitative analysis, since there is less interference from both solvent and blank at the lower wavenumber. Dimethicone-spiked blank samples were prepared at various levels and analyzed in order to perform a recovery study (Table I). An unsubtracted spectrum (Figure 6) shows the dimethicone peaks severely masked by interferences. The solvent-subtracted spectrum of the same sample (Figure 7) shows the dimethicone doublet with much improved Table I Spiking/Recovery Data and Results for Dimethicone in Prototype Lotion w/w % Added w/w % Found % Recovered Single Level Mean ___ • 0.767 0.990 129.1 0.767 0.969 126.3 • 126.9 -+ 1.8 0.767 0.963 125.5 • 0.994 1.088 109.5 0.994 1.137 114.4 • 111.7 _+ 2.5 0.994 1.106 111.3 1.487 1.596 107.3 1.487 1.590 106.9 •__ 107.8 _-4- 1.2 1.487 1.622 109.1 $ • 9. X = 115.5% recovered. (• -- 8.9. Figure 6. Dimethicone-spiked blank formulation spectrum, 1.00% w/w spiked level.
Purchased for the exclusive use of nofirst nolast (unknown)
From: SCC Media Library & Resource Center (library.scconline.org)