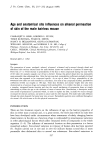
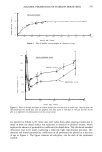
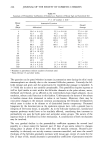
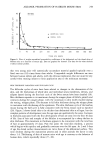
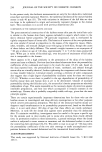
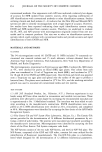
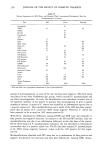
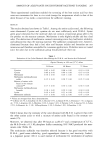
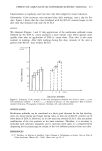
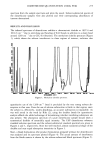
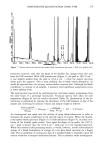
DIMETHICONE QUANTITATION USING FTIR 279 ,,•G•o.o 40•0.o •,•0.o k•oOo.o •oo.o 19o0.o 1Goo.o Figure 7. Solvent-subtracted dimethicone-spiked blank formulation spectrum, 1.00% w/w spiked level. resolution however, note that the shape of the doublet has changed from that seen from the USP standard. With USP dimethicone (Figure 3), the peak at 1097.6 cm-• is just slightly smaller than the peak at 1014.6 cm -•, while the sample spectrum shows quite the opposite. This is most probably due to blank matrix absorption. As would be expected then, the recovery values exhibit a positive bias. Although the blank interference is constant in all samples, it produces more significant quantitation errors at lower spiking levels. The total method was tested by performing four individual sample preparations from the same batch of a prototype moisturizer. Triplicate spectra were taken for each preparation (Figure 8) and the results calculated (Table II). Quantitation of the di- methicone is performed by ratioing the absorbance of t'he USP standard to that of the sample and correcting for solution volume and sample weight as follows: ConC(sTo)(g/ml) 15.00 ml X AbS(sAMP) X X 100 = % D found AbS(sTD ) Sarnp. Wt (g) An investigation was made into the validity of using blank-subtraction in order to eliminate the matrix interference in the spectral region of interest. When the dimeth- icone-spiked blank spectrum (Figure 6) is blank-subtracted (Figure 9), excellent reso- lution of the doublet peaks results. Note again the shape of the peaks: the 1097.6- cm-1 peak is shorter than the 1014.6-cm-1 peak just as in the standard spectrum. While this method yields promising results, it would, however, involve either physical storage of a blank formulation or storage of a raw data blank spectrum on a floppy disk. The acceptability of storing raw data of a standard blank is dependent upon the routine variations in sample formulation batches. This is presently under investigation.

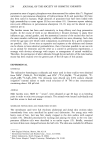
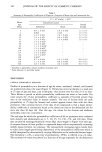
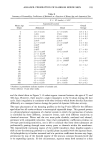
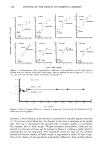
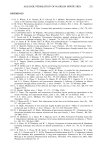
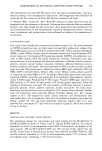
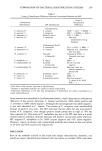
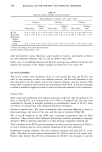
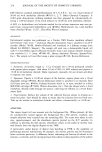
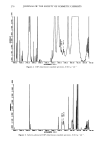
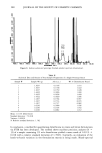
280 JOURNAL OF THE SOCIETY OF COSMETIC CHEMISTS NIW•IJI'OI]• tl:Pl-] 1 Figure 8. Solvent-subtracted prototype finished product spectrum (moisturizer). Table II Statistical Data and Results of Four Sample Preparations of a Single Prototype Batch Sample # Sample Wt (g) Abs (a.u.) Wt % Dimethicone Found 1 1. 3637 0.1764 1.031 1 1.3637 0.1748 1.022 1 1.3637 0.1759 1.028 2 1.4422 0.1826 1.009 2 1.4422 0.1826 1.009 2 1.4422 0.1820 1.006 3 1.4107 0.1764 0.997 3 1.4107 0.1733 0.979 3 1.4107 0.1737 0.982 4 1.6236 0.2090 1.026 4 1.6236 0.2103 1. 032 4 1.6236 0.2062 1.012 Mean: 1.011% Dimethicone Standard deviation: _+ 0.018 Variance: 0. 00030 % Relative standard deviation: 1.782 In conclusion, a method for quantitating dimethicone in cream and lotion formulations via FTIR has been developed. The method shows excellent precision analyses (N = 12) of a sample containing 1% w/w dimethicone yielded a mean result of 1.011% ___ 0.018 with a relative standard deviation of 1.782%. Currently, an evaluation of the batch-to-batch variation in the formulation matrix is being made. Blank-spectral
Purchased for the exclusive use of nofirst nolast (unknown)
From: SCC Media Library & Resource Center (library.scconline.org)