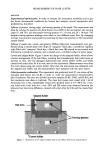
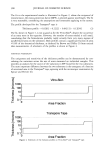
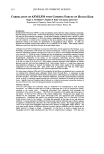
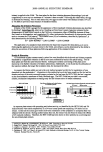
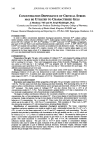
j. Cosmet. sci., 51, 303-315 (September/October 2000) A mathematical approach for the analysis of in vitro sun protection factor measurements D. F. TUNSTALL, Spring House, Fylingdales, Whitby, North Yorkshire, Y022 4 QQ, U.K. Accepted for publication August 11, 2000. Synopsis A mathematical analysis of the spectral UV mono-protection curves of formulations based on organic absorbers is described, which derives a thickness profile for formulations applied to artificial substrates. To illustrate the potential of the analysis, profiles for an octyl methoxycinnamate formulation at three absorber concentrations applied to Transpore © tape and Vitro-Skin © are used to detect the experimental errors observed in the mono-protection curves for these systems. The variations of sun protection factors with concentration are then explored. The wide-ranging potential benefits of this type of analysis are described. INTRODUCTION Considerable concern exists within the sunscreen market about the accuracy of in vitro sunscreen protection assessments. The tests for sun protection factor (SPF) assessment were developed by comparison with in vivo measurements, and equipment and test substrates evolved for organic-based UV absorbers within the constraints of having to match the in vivo data. The advent of mineral, or inorganic, UV attenuators introduced in vitro measurement inconsistencies. It is accepted [e.g., Sayre (1)] that development of in vitro tests cannot be based on simple transmission spectra. Sayre et al. (2) had previously resorted to the use of hairless mouse skin. Diffey had shown that good correlation with in vivo results could be ob- tained by measuring the spectral transmittance of formulations applied to excised human cadaver skin. Diffey and Robson then developed a test (3) using a surgical tape (Tran- spore © tape, 3-M Corporation) designed to allow skin to "breathe," which became an adopted market in vivo test. O'Neill (4) showed that the non-uniformity of sunscreen distribution on the skin could satisfactorily account for the discrepancy between clinical results and simple spectrographic data. Brown and Diffey (5) subsequently showed that a substantial thinning of the formulation on skin to 6-10% of its theoretical uniform thickness was needed to achieve results comparable with their excised skin measure- ments. Spruce and Hewitt (6) have since shown that with Transpore © tape as a substrate, a small fraction of uncovered holes (i.e., in effect, zero thickness) occurs. A new substrate 3O3

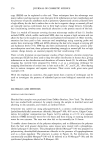
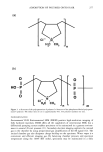
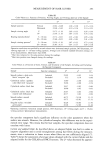
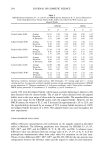
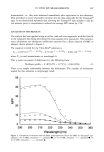
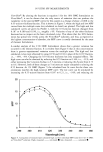
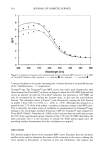
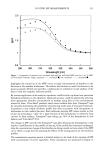
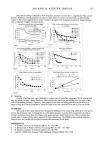
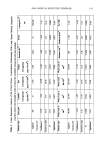
304 JOURNAL OF COSMETIC SCIENCE designed to closely simulate skin has since become available (Vitro-Skin ©, IMS Testing Group). This paper analyzes these two substrates and develops a much better understanding than hitherto of the in vitro assessment of sunscreens. It describes an approach that allows a good approximation for the actual distribution of thicknesses of a formulation on sub- strates to be determined. It is demonstrated how powerful this kind of data can be for understanding the origins and errors of SPF results on different substrates. EXPERIMENTAL THE CALCULATION The expected uniform thickness for an application of 2 t•l/cm 2, the standard test appli- cation for sunscreen SPF assessment, is 20 microns. A model is adopted where a range of varying thicknesses, each at a fraction of unit area, is used to calculate the spectral transmittance of the system. At each wavelength the transmittance of each thickness is determined using a simple exponential transmission law [Beer-Lambert Law (7)]: Table I MPFs, SPFs, and UVA/UVB for 1 wt %, 2.5 wt %, and 10 wt % OMC Formulations on Two Substrates Transpore © tape Vitro-Skin © Wavelength 1 wt % 2.5 wt % 10 wt % 1 wt % 2.5 wt % 10 wt % 290 4.76 10.78 37.69 2.12 4.97 12.25 295 4.99 11.64 40.22 2.16 5.31 14.57 300 5.11 12.06 41.04 2.18 5.42 15.81 305 5.16 12.25 41.82 2.17 5.43 16.44 310 5.01 11.88 42.04 2.11 5.28 16.58 315 4.54 10.43 39.27 1.99 4.83 15.7 320 3.79 8.12 33.84 1.79 4.06 13.93 325 2.88 5.34 23.71 1.54 3.04 10.64 330 2.11 3.21 12.35 1.31 2.13 6.47 335 1.64 2.08 5.73 1.16 1.57 3.49 340 1.38 1.55 2.99 1.08 1.29 2.04 345 1.24 1.31 1.93 1.04 1.16 1.44 350 1.17 1.18 1.49 1.02 1.09 1.18 355 1.13 1.12 1.29 1.01 1.06 1.07 360 1.11 1.09 1.19 1.01 1.04 1.02 365 1.1 1.08 1.14 1 1.02 0.99 370 1.1 1.07 1.11 1 1.02 0.98 375 1.09 1.06 1.1 1 1.01 0.97 380 1.09 1.06 1.09 0.99 1.01 0.97 385 1.09 1.06 1.09 0.99 1 0.97 390 1.09 1.06 1.08 0.99 1 0.97 395 1.08 1.05 1.08 0.99 0.99 0.96 400 1.08 1.05 1.08 0.99 0.99 0.96 SPF 3.72 6.38 12.41 1.89 3.82 7.86 (0.89) (0.83) (1.78) (0.09) (0.22) (0.12) UVA/UVB 0.17 0.16 0.21 0.11 0.14 0.18
Purchased for the exclusive use of nofirst nolast (unknown)
From: SCC Media Library & Resource Center (library.scconline.org)