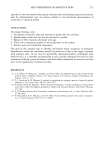
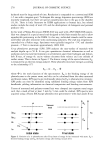
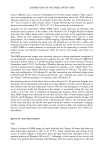
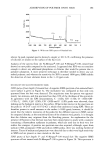
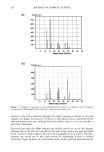
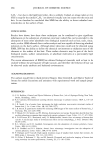
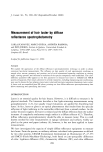
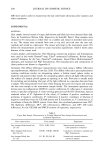
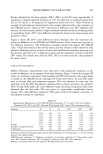
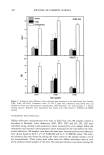
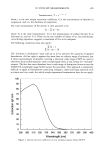
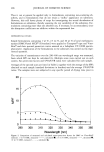
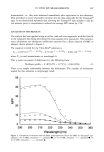
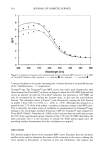
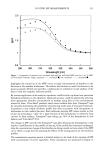
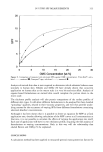
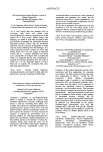
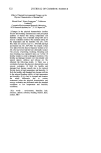
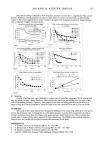
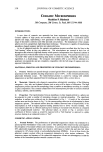
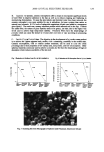
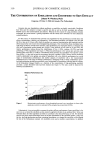
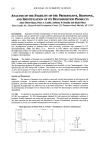
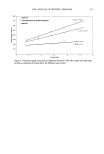
IN VITRO SPF MEASUREMENTS 309 Vitro-Skin ©. By altering the fractions in equation 1 for the 10% OMC formulation on Vitro-Skin © , it can be shown that the only source of variation that can produce the variability in the spectral MPF curves for this system is a change of about +0.008 in the 0.55-micron-thickness fraction. This is shown in Figure 5, where the high and low MPF curves from the multiple scans (not tabulated in detail) are plotted. The high and low calculated curves are given by Profile 1, with the 0.55-micron fraction changed from 0.187 to 0.180 and 0.196, i.e., roughly +4%. Variation of any of the other thickness fractions has no impact on the basic calculated curve. This shows that the 10% formu- lation has spread very evenly across the Vitro-Skin © substrate, and that, as expected at the highest concentration of absorber, the MPF curve is totally dominated by the areas of thinnest formulation. A similar analysis of the 2.5% OMC formulation shows that a greater variation has occurred in the thinnest fraction. It is evident from Figure 6 that at this concentration there is greater experimental variation across the multiple scans. The high and low calculated curves were obtained by using 0.150 and 0.192 in place of the 0.187 fraction, i.e., -19%, +4%. Changing the 0.55-micron thickness has only marginal effects. The high curve can also be obtained by reducing the 0.55 fraction to 0.164, i.e., -11%, and either increasing the 5-micron thickness to 5.5 microns or reducing the fraction from 0.75 to 0.6. However, both of these changes at 5 microns are major compared to altering the 0.55 fraction. At 1% OMC (Figure 7) the calculated best fit curve for the three con- centrations matches the high-variation MPF curve. The low curve can be simulated by increasing the 0.55-micron fraction from 0.187 to 0.21, i.e., +14%, and reducing the 2O 15 •- 10 290 300 310 320 330 340 350 360 Wavelength [nm] Figure 5. Comparison of measured and calculated high and low individual MPF scans for 10 wt % OMC on Vitro-Skin © substrate. High, measured --, calculated I low, measured ....... , calculated O.

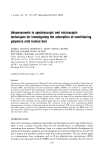
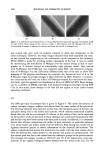
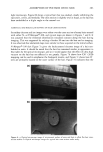
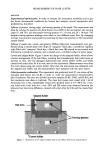
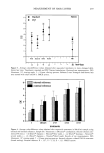
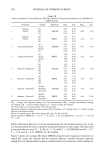
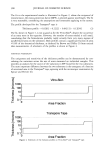
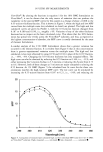
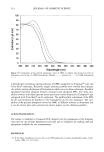
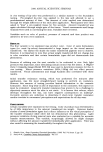
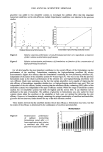
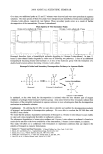
310 JOURNAL OF COSMETIC SCIENCE 290 300 310 320 330 340 350 360 Wavelength [nm] Figure 6. Comparison of measured and calculated high and low individual MPF scans for 2.5 wt % OMC on Vitro-Skin © substrate. High, measured --, calculated m low, measured ....... , calculated O. 5-micron thickness to 4 microns. Increasing the 5-micron fraction is not possible because of the "Sum(Fractions) -- 1" requirement. Transpore © tape. The Transpore © tape MPF curves vary much more dramatically than those obtained on Vitro-Skin ©, as shown in Figure 8, where the 10% OMC high and low curves are plotted. As with the Vitro-Skin © substrate, the variations at 10% OMC can only be accounted for by varying the thinnest areas, in this case the zero-thickness fraction. The calculated curves in Figure 5 were obtained by varying the 0.02 fraction in profile 2 from 0.012 to 0.039, i.e., -40%, to +95%. Although this amounts to a spread of only 2.7% of the total surface, it produces a dramatic change in the MPF curve. This is obviously the major source of variability in measurements on Transpore © tape, leading to the much larger standard deviations in SPF for Transpore © tape compared to Vitro-Skin © (Table I). Variations of + 100% in the 2-microns fraction could only account for 25 % of the experimental spread. Analysis of the 2.5 % and 1% OMC data follow the same procedure, but it is not necessary to include the whole process again since the preceding analysis demonstrates how the calculations are applied. DISCUSSION The detailed analysis above of the measured MPF curves illustrates how the thickness profiles can be used to determine the source of the variations in the curves, relating the curve spreads to fluctuations in fractions of area and thicknesses. The analysis also
Purchased for the exclusive use of nofirst nolast (unknown)
From: SCC Media Library & Resource Center (library.scconline.org)