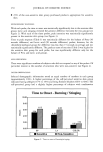
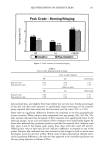
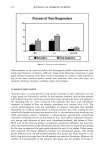
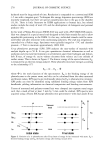
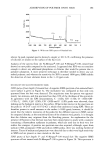
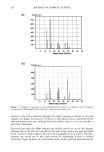
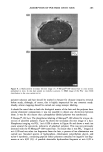
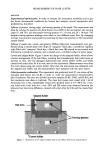
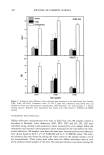
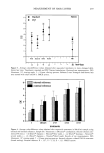
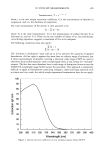
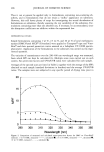
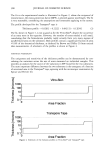
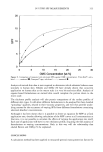
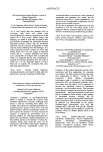
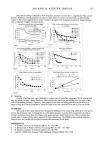
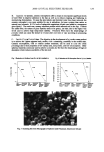
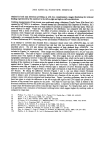
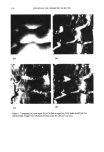
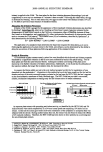
2000 ANNUAL SCIENTIFIC SEMINAR 339 irritant, is applied to the CAM. The time taken for the three irritation phenoma (hemorrhage, lysis and coagulation) to occur up to a maximum of 5 minutes is then recorded. Following this observation, the egg is destroyed by freezing. Prior to each assay trial, two eggs are also tested with standard irritant (15% LA or 1% SDS) to provide a basal measure of standard irritation. Measuring The Irritation Phenomena Irritation of the CAM is gauged by the appearance of three landmark irritation phenomena (as described by Steilingl): hemorrhage (H), observed as bleeding out from blood vessels lysis (L), indicated by the disappearance of small blood vessels on the CAM as a consequence either of bleeding, dystonia of these fine vessels or disintegration and coagulation (C), either intravascular (thrombosis) or extravascular which tends to increase the CAM opacity. The irritation score (IS) of a substance, described by Spellmann 5, is then determined by the following formula: IS: [(301-H)/30015 + [(301-L)/30017 + [(301-C)/30019 The application of a standard irritant determines the basal time required for these phenozaa to occur. Following the application of a plant extract to the CAM, anti-irritancy can be determined by the ability to delay the occurrence of these phenoma following application of the standard irritant. Results & Discussion Of a multitude of plant extracts tested, a select few were identified which showed anti-irritant properties illustrated by a significant reduction in the IS score and confirmed by human skin patch testing. Two of these plants are from the same botanical family. Subsequent isolation and testing of the plant active showed an even further reduction of irritation phenomena. Additionally, it was found that by utilization of the injection method, the longer the incubation time, the increased the effect. At present, the Draize rabbit eye test is the only method accepted worldwide for registration of new chemicals into the marketplace I. Alternatives to this method have actively been sought out for the last few decades and one of the most successful assays evaluated so far has been the HET-CAM, the hews egg-test on the chorioallantoic membrane of fresh, fertilized eggs. The HET-CAM has provided a convenient, reliable, mechanism-independent screening assay for anti-irritant action of natural substances. Hydrocortisonc Plant extracZ HET-CAM T•ting Plant Extract (Solntlon and Lotion) Reduce• UV-induced Erythema 25 ll t 20 mummmamma 0 o i t 3 4 s ß ? ist Sirs of Ir•jtatioa I•ødy Factor (Sample Deh.vlCoatrol Delay) 4 24 Hours After Treatment • n Ut%l•m •r ufk. t EI•,I• IoU• Plant Extract Reduces Chemically Induced Erythema 13 Control ß Plant extract 50 :• 20 .• •o o 0.5 I 4 24 Hours After Treatment An aqueous plant extract with promising anti-irritant activity, as identified by the HET-CAM, and 1% hydrocortisone were tested competitively in a 24-hour human patch test employing 15% lactic acid as irritant. In this test the extract gave better short-term remediation of the symptoms or symptoms than was obtained with the steroid. During another human skin test, the extract was also found to reduce the effects ofUV-induced erythema. Therefore, the HET-CAM has been shown to have potential as a screening tool for anti-irritant plant extracts. 1 - Steiling W., Braeher M., Courtellemont P. & de Silva O. 1999. Toxicology in Vitro 13: 375-384. 2 - BagIcy D.M., Waters D. & Kong B.M. 1994. Fd Chem. k Toxic. 32(12): 1155-1160. 3 - Leighton J., Nassauer J. & Tchao R. 1985. Fd Chem. Toxic. 23(2): 293-298. 4 - Dannhardt G., Kreher M., Nowe U. & Pies A. 1996. Arch. Pharm. Pharm. Med. Chem. 329:301-310. 5 - Spielmann H. 1995. In: O'Hare S. & Atterwill C.K. (eds) Methods in Molecular Biology Vol.43: In Vitro Toxicity Testing Protocols. Humana Press Inc., Totowa NJ

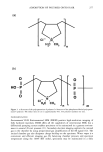
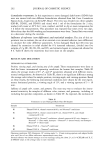
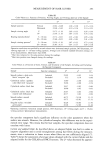
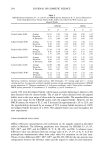
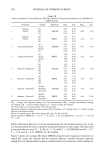
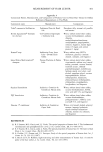
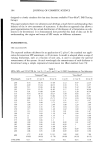
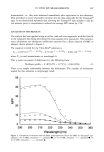
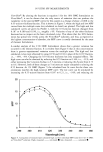
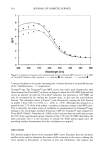
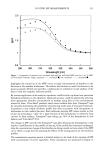
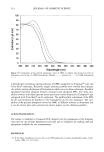
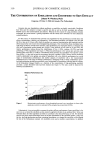
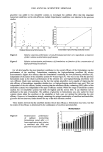
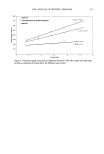
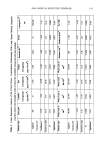
340 JOURNAL OF COSMETIC SCIENCE CONCENTRATION DEPENDANCE OF CRITICAL STRESS MAY BE UTILIZED TO CHARACTERIZE GELS J. Mendoza•, 2 MS and M. Serpil Kislalioglu •, Ph.d. •Cosmetics and Personal Care Products Technology Program, College of Pharmacy, The University of Rhode Island, Kingston, R102881 and 2Chemex Chemical Manufacturing and Exporting Co., PO Box 1448, Tegucigapa, Honduras, C.A. INTRODUCTION In order to define concentration dependent rheological parameters, Bentonite RV ©, sodium carboxy methyl cellulose, methyl cellulose (Methocel A4C•), hydroxypropyl methyl cellulose (Methocel KM4•), pectin USP-100, Carbopol 971 NF ©, RLV•(lambda), VVllPF © (iota) and W711 • (kappa), carrageenans, guar gum U-NF and Water Lock (starch/acrylates/acryamide copolymers) A-100 ©, A-180 ©, DD-223 © and G-400 © were studied with oscillatory viscometry at nondestructive and destructive modes. The elastic (G'), viscous (G") and complex moduli (G*), complex viscosity (q*), strain (•,) and the phase angles (o0 were measured at the linear region where G' is independent of the shear stress. Critical stress ((•c) at (G') and (G") were also determined from the instruments output. EXPERIMENTAL Preparation of the gels: The gels, with exception of Carbopo1971 ©, were prepared by adding sterilized distilled water to the polymer powder to obtain the pre-selected (w/w) concentration. The mixtures were left for swelling for 24 hours. They were homogenized using a Fisher Scientific (Pittsburgh, PA) Dyna- mix stirrer at 1000 rpm for 1 hr. Carbopol 971 © was prepared with 1N NaOH neutralization. The concentrations used varied from 0.3% to 7.0% with no less than a 3 fold increment for each range. Five different concentrations per gel were uscck Rheological measurements: The measurements were taken within 2448 hours of preparation. The theological behavior of the gels was characterized at each concentration using a Boldin Instruments Rheometer Model CVO. A stainless steel, plate and plate spindle (number 4) with 1 nun gap was used at a strain range of 0.00075 - 15 nun and frequency of 0.05 Hz. Measurements were taken at 25 øC. RESULTS AND DISCUSSION Description and comparison of flow properties of the gels: The gel strengths varied from 0.001Pa to 7,600 Pa. The flow types were both shear thinning and shear thickening. With increasing stress, the G" of sodium carboxy methylcellulose, methylcellulose, pectin and guar gum decreased, whereas G" of Carbopol 971 © increased. The elastic nature of Carbopol 971 © was also obvious from low o[ (10 ø) at all concentrations studied (0.5 - 5.0%). Pectin demonstrated a gradual decline in G' that is characteristic of a low molecular weight polymer with a broad molecular weight distribution. The degree of sulfate esterification influences the viscoelastic properties of carmgeenans. At the same concentration, the o• of iota carmgeenan was almost 90 ø. It has a lesser degree of esterification than lambda carrageenan. Kappa earmgeenan, having the least degree of esterffication, demonstrated purely viscoelastic behavior at 1% concentration. Its o• is around 20 ø. Water Locks form solid gels with high degree of G' which was in the order of 500 - 1000 Pa at 1% concentrations. With exception of Water l_x)ck A-180 ©, they showed an increment in G" with increased stress, denoting dilatant behavior. Identification of concentration dependent theological parameters: The linear, exponential, logarithmic and power equations were tested as models to seek a relationship between the (G'), (G"), 01'), (G*), (,/) and (o0 at the linear region and ((•c) at (G') and (G") respectively, and concentration. The only parameter that provided a relationship with concentration in the gels studied was the (•, at (G') which can be written as ((•,=o• + s. C), where s is called the sensitivity index, Table I. The sensitivity indices given in Table I can be further categorized into three groups: In gels where • 10, the internal elasticity increases greatly with small increments in concentration. In gels with s=l-10, the concentration moderately influences internal elasticity. The gels with • 0.01-0.9 poorly respond to concentration changes. Sensitivity index may be useful for quick evaluation of the gels based on their concentration. The model proposed was applicable to gels of different chemical structures, molecular weights, molecular weight distributions, chain structures and viscosity types therefore, it may be considered as a tmiversal model to describe the gel strength with reference to concentration.
Purchased for the exclusive use of nofirst nolast (unknown)
From: SCC Media Library & Resource Center (library.scconline.org)