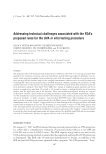
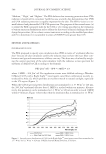
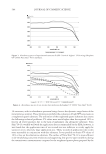
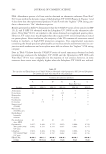
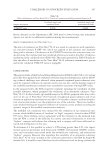
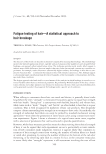
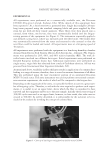
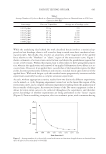
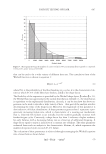
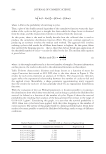
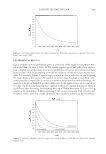
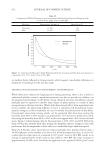
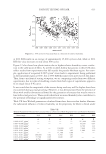
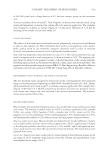
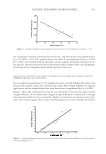
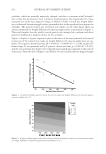
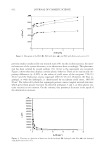
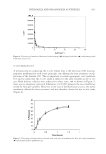
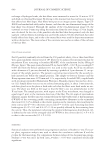
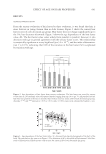
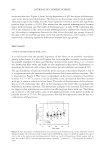
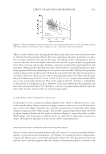
JOURNAL OF COSMETIC SCIENCE 604 INFLUENCE OF FATIGUING STRESS MAGNITUDE ON THE NUMBER OF CYCLES-TO-FAIL—THE S-N CURVE Instinctively, the magnitude of the fatiguing stress would be expected to have an infl u- ence on the number of cycles-to-fail. That is, samples that receive a higher fatiguing stress will have a tendency to fail faster. In fatigue testing this relationship is commonly represented by what is termed an S-N curve, where the stress is plotted against the loga- rithm of the number of cycles to failure. Figure 4 shows such a plot for Caucasian hair equilibrated at 60% RH. From the regression line it becomes possible to evaluate an average number of cycles-to- break as a result of the applied stress. Table I shows this information and also, for easier reading, converts the stress back into a force based on an average-sized 70-um fi ber. From conventional constant-rate extension testing, it can be determined that, on average, a healthy 70-um hair fi ber typically breaks upon application of an approximate 80 g force at 60% RH. However, from Table I, it can be seen that repeated application of a 55 g force on a 70-um hair fi ber would be expected to induce breakage after around 400 cycles. In fact, results suggest that a repeating force that is only half that of the break force would still be expected to induce breakage after approximately 14,000 cycles. This illustrates the point made previously regarding the relevance of results obtained from conventional stress-strain experiments with regard to actual consumer practices. While the regression line allows for an estimation of the number of cycles-to-fail under a given repeated stress, from Figure 4 it is clear that there is considerable spread in the data. A repeating 40 g force on a 70-um fi ber may result in an average of 14,000 cycles-to- break, but breakage occurred as early as 1000 cycles, and some samples survived all 300,000 cycles. As will be shown later, this distribution is used in the analysis and mod- eling of the likelihood of breakage. From these results, it is possible to observe an exponential relationship between the stress and the number of cycles-to-break (Figure 5). Thus, we begin to visualize how a reduc- tion in grooming force (as provide by conventional conditioning products) has a dramatic infl uence on the propensity for hair breakage. This is an area that will be discussed more fully after outlining the data analysis method. Figure 4. S-N curve for Caucasian hair at 60% RH.

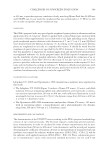
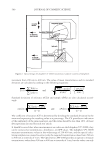
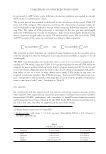
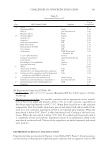
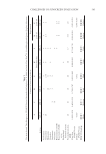
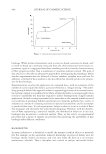
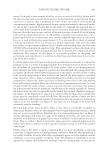
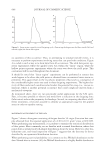
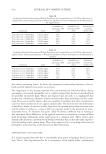
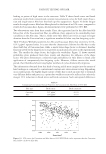
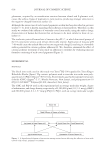
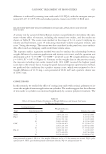
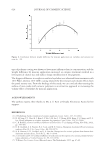
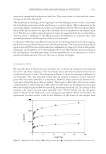
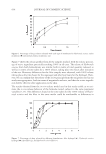
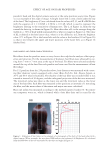
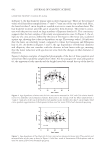
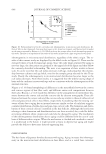
FATIGUE TESTING OF HAIR 605 While the underlying idea behind the work described herein involves a statistical ap- proach to hair breakage, there is still a need to keep in mind some basic mechanical test- ing principles. Specifi cally, this involves an awareness of the magnitude of the applied force relative to the “Hookean” or “elastic” region of the stress-strain curve. Figure 1 shows a schematic of a stress-strain curve for hair, and shows the pseudolinear region that occurs at low strains. Within this region, hair is often taken to have spring-like proper- ties, wherein the application and removal of an applied deformation leaves fi bers in a re- covered state. However, if an applied force exceeds that of the linear-like region, the fi ber yields, becomes permanently deformed, and retains a residual strain upon removal of the applied force. With each fatigue cycle this residual strain progressively increases and the experiment essentially becomes a complex extension experiment. As such, without appropriate scrutiny, results from two distinctly different experiments can be mixed—a cyclic fatiguing experiment carried out in the linear-like region of the stress-strain curve, and a complex extension experiment resulting from the application of forces outside of this region. An attractive feature of the Dia-stron equipment is that it allows for stress-strain curves to be collected throughout the experiment, and therefore proves knowledge of whether experiments are being performed in the “linear” region (Figure 6). From a modeling viewpoint, this is an academic point, with consumers having Table I Average Number of Cycles-to-Break as a Function of Fatiguing Stress as Obtained from an S-N Curve Created at 60% RH Stress range Force on 70-μm fi ber Average no. of breakage cycles 0.0145 g/μm2 55.8 g 370 0.0135 g/μm2 52.0 g 920 0.0125 g/μm2 48.1 g 2,300 0.0115 g/μm2 44.3 g 5,700 0.0105 g/μm2 40.4 g 14,100 0.0095 g/μm2 36.6 g 35,100 0.0085 g/μm2 32.7 g 87,300 Figure 5. Average number of cycles-to-fail versus break stress as a function of applied stress as obtained from the S-N plot for Caucasian hair at 60% RH.
Purchased for the exclusive use of nofirst nolast (unknown)
From: SCC Media Library & Resource Center (library.scconline.org)