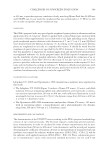
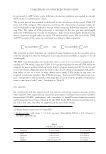
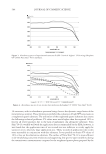
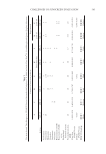
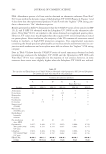
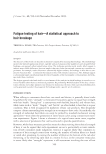
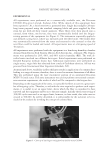
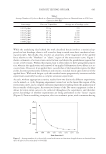
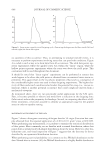
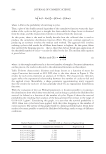
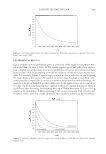
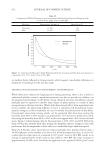
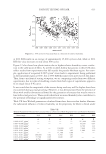
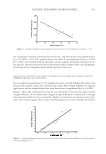
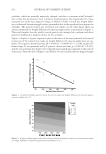
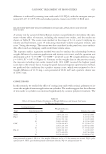
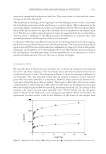
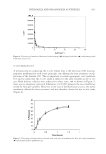
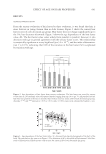
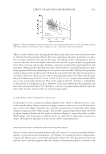
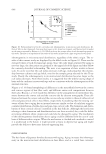
JOURNAL OF COSMETIC SCIENCE 608 @ ln ln(1 F(x)) lnx) lnD ª E E (3) where 1–F(x) is the probability of surviving x cycles. Thus, a plot of the double natural logarithm of the cumulative function versus the loga- rithm of the cycles-to-fail gives a straight line from which the shape factor is obtained from the slope, and the characteristic lifetime is obtained from the intercept. At this point, there is the need to briefl y describe how the collected data is used to produce the cumulative distribution function (F(x)). The most common approach to producing an estimate involves the median rank method. The approach fi rst involves ordering cycles-to-fail results for all fi bers from lowest to highest. At this point, fi bers that survived the fatiguing process—that is, those that did not break upon application of the threshold number of cycles—can also be added to the list. The median rank equation is given below: i 0.3 Median rank (Xi) n 0.4 = (4) where i is the sample number and n is the total number of samples. For more information on this process, the reader is directed to the substantial literature on this subject. Table II shows characteristic lifetimes and shape factors as a function of stress for virgin Caucasian hair tested at 60% RH, that is, the data shown in Figure 4. The results for each stress represent an analysis of 50 fi bers. The characteristic lifetimes again refl ect the exponential relationship between the number of cycles-to-fail and the applied stress. Meanwhile, a shape parameter approximating unity suggests that the results for each set of data generally abide by an exponential distribution function. With the evaluation of the two Weibull parameters, it becomes possible to reconstruct the distribution from which they were derived, and in doing so, predict the likelihood for survival (or failure) as a function of the number of cycles. Figure 8 shows the survival probability plot resulting from analysis of the data generated for stresses in the range of 0.010–0.011 g/μm2. Considering this graph, it is seen that the survival probability is 100% when zero cycles have been applied, with this value dropping as the number of cycles increases. The inverse of this graph would be a failure probability plot. From these results it becomes possible to model the likelihood of breakage under a range of different conditions. Table II Weibull Parameters for Caucasian Hair at 60% RH as a Function of Applied Stress Stress range Characteristic lifetime, α Shape factor, β 0.013–0.014 g/μm2 1,640 1.07 0.012–0.013 g/μm2 3,760 1.01 0.011–0.012 g/μm2 11,100 0.90 0.010–0.011 g/μm2 23,200 1.01 0.009–0.010 g/μm2 114,000 0.77

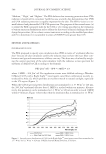
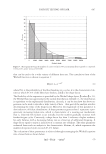
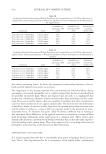
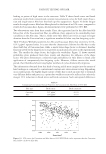
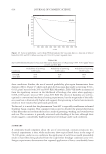
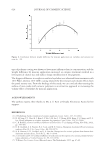
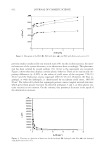
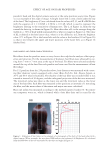
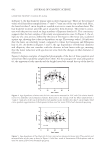
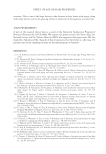
FATIGUE TESTING OF HAIR 609 EXPERIMENTAL RESULTS Figure 9 shows survival probability plots as a function of the applied stress, which were calculated from the data in Table II. The results appear logical, and refl ect how applica- tion of higher stresses decreases the survival probability. However, the usefulness of these plots becomes clear in attempting to model the infl uence of different experimental vari- ables. For example, Figure 5 convincingly reminds us that a reduction in the fatiguing force can dramatically increase the number of cycles before breakage occurs. Now it be- comes possible to express this occurrence in terms of the probability of fi ber breakage. An example is shown in Table III, in which differences in the applied stress are accounted for in terms of a decreasing fatiguing force applied to fi bers of common dimension. Thus, it is predicted that decreasing the fatiguing force on a 70-μm fi ber from 52.0 g to 36.6 g results in the probability of fi bers surviving 5,000 cycles, increasing from virtually zero to almost 100%. This very clearly illustrates the benefi ts of lubricating hair treatments Figure 8. Survival probability plot for virgin Caucasian hair fi bers when exposed to a repeated 0.010–0.011 g/um2 stress at 60% RH. Figure 9. Survival probability plots for virgin Caucasian hair fi bers at 60% RH as a function of repeated applied stress.
Purchased for the exclusive use of nofirst nolast (unknown)
From: SCC Media Library & Resource Center (library.scconline.org)