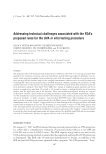
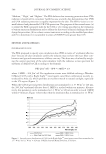
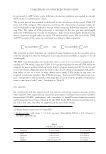
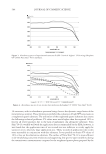
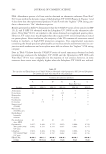
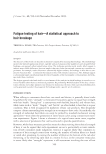
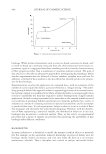
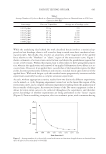
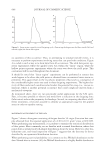
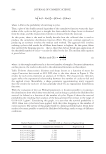
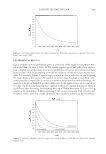
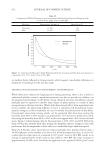
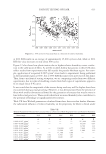
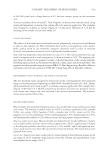
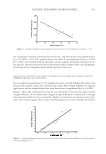
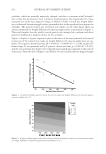
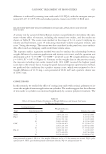
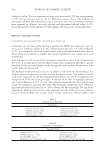
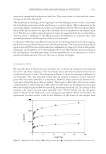
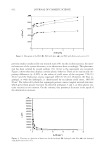
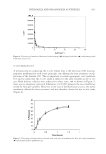
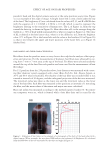
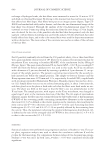
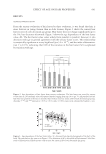
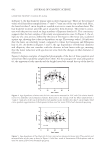
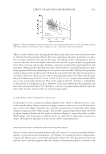
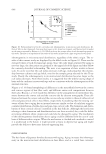
JOURNAL OF COSMETIC SCIENCE 612 are perhaps better refl ected in fatigue results, which suggest considerable differences in propensity for breakage for the two hair types. THE EFFECT OF PLASTICIZATION ON THE PROBABILITY OF HAIR BREAKAGE While lubrication reduces the fatiguing force during grooming, there is also a desire to understand whether cosmetic ingredients penetrate into hair to provide any infl uence on the propensity for breakage. In the absence of any chemical reactions, the infl uence of such materials may be expected to involve some degree of plasticization as a result of their incorporation in the hair structure. While well-characterized effects from ingredients may not be available, the plasticizing infl uence of water is extremely well documented. Conse- quently, changes in relative humidity are used to modify the plasticization of hair fi bers. Conventional stress-strain testing results can be generated that show how raising the humidity from 60% to 90% results in an approximate 15% decrease in break stress, while decreasing the humidity from 60% to 20% results in an approximate 10% increase in break stress. Figure 12 shows fatigue data for Caucasian hair at 20%, 60%, and 90% RH in the form of S-N plots. Results show that altering the humidity induces changes in line with predictions, but the magnitude of these effects is considerably larger than anticipated. From the S-N plots, these alterations in relative humidity have produced better than a 10-fold infl uence in the number of cycles-to-fail. From the regression lines, it can be cal- culated that the application of a repeated 0.0125 g/um2 stress at 60% RH results in an average of approximately 2,000 cycles-to-fail, while at 20% RH this value increases to approximately 45,000 cycles. Similarly, the application of a repeated 0.0095 g/um2 stress Table VI Comparison of Weibull Parameters for Caucasian and Afro Hair after Repeated Fatiguing with a 0.010–0.011 g/μm2 Stress at 60% RH Hair type Characteristic lifetime, α Shape factor, β Caucasian 23,200 1.01 Afro 12,600 0.39 Figure 11. Survival probability plots (from Weibull analysis) for Caucasian and Afro hair upon exposure to a repeating 0.010–0.011 g/um2 stress at 60% RH.

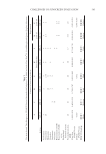
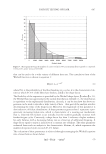
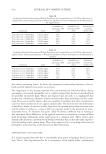
FATIGUE TESTING OF HAIR 613 at 60% RH results in an average of approximately 45,000 cycles-to-fail, while at 90% RH this value decreases to only about 900 cycles. Figure 12 also shows how plasticization due to higher relative humidity causes a reduc- tion in the yield point of fi bers. As will be recalled, hollow data points in these S-N plots refl ect results from experiments that fall outside the pseudo-Hookean region. For exam- ple, application of a repeated 0.0095 g/um2 stress leads to experiments being performed in the linear-like region at 60%, but at 90% RH this same stress now exceeds this limit. Thus, from a mechanical testing viewpoint, we are comparing results from two different experiments, but in terms of modeling, results from both types of experiments appear to fi t on single linear S-N curves. It was noted that the magnitude of the stresses being used may well be higher than those encountered during actual grooming. However, it was demonstrated how the presence of fi bers with smaller dimensions allowed for the generation of stresses that may be more in line with actual practices. These results show how increased humidity also contributes to the potential of breakage at signifi cantly lower stresses. Table VII lists Weibull parameters calculated from these data sets that further illustrate the substantial infl uence of relative humidity on the propensity for fi bers to break under Figure 12. S-N curves for Caucasian hair as a function of relative humidity. Table VII Weibull Parameters Obtained for Caucasian Hair as a Function of Both Repeated Stress and Relative Humidity Stress range 20% RH 60% RH 90% RH α β α β α β 0.006–0.007 g/μm2 — — — — 213,000 0.86 0.007–0.008 g/μm2 — — — — 53,300 0.67 0.008–0.009 g/μm2 — — — — 8,700 1.21 0.009–0.010 g/μm2 — — 114,000 0.77 2,040 1.26 0.010–0.011 g/μm2 — — 23,200 1.01 1,080 1.42 0.011–0.012 g/μm2 — — 11,200 0.90 — — 0.012–0.013 g/μm2 100,000 0.62 3,760 1.01 — — 0.013–0.014 g/μm2 27,700 0.65 1,640 1.07 — — 0.014–0.015 g/μm2 8,750 0.60 — — — —
Purchased for the exclusive use of nofirst nolast (unknown)
From: SCC Media Library & Resource Center (library.scconline.org)