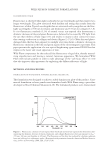
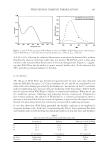
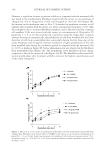
JOURNAL OF COSMETIC SCIENCE 314 studies, respectively. Cells were initially cultured in the culture medium at 37°C for 24 h. Then the medium in each well was replaced with serum-free DMEM containing vari- ous concentrations of the extract (0.5, 1, 2, 5, 10, 20, and 50 μg/ml). Dimethyl sulfoxide (DMSO, 99.5% GC, Sigma-Aldrich, Inc., Missouri) was used to enhance the solubility of the extract in DMEM, and the amount used was not more than 0.1% in the fi nal concen- tration. There were three groups of cultures: (i) serum-free DMEM (untreated group), (ii) serum-free DMEM + DMSO (0.1%, control group), and (iii) serum-free DMEM + extract (treated group). Cell viability and proliferation assay. The activity of mitochondrial dehydrogenases was determined by the 3-(4,5-dimethylthiazol-2-yl)-2,5 diphenyltetrazolium bromide test (MTT, Sigma-Aldrich, Inc.). This test is an alternative method to measurement of the cellular viability as mitochondrial dehydrogenases from living cells are able to convert soluble MTT to an insoluble formazan via a reduction reaction. After incubation under 5% CO2 at 37°C for 24, 48, or 72 h, the cell-free supernatants were removed and replaced with 100 μl of serum-free DMEM. Fifteen microliters of MTT solution (5 mg/ml in PBS) was added to each well. After incubation for 4 h, 100 μl of extraction buffer consisting of 10% w/v sodium dodecyl sulfate (Sigma-Aldrich, Inc.) in 0.5 M N,N-dimethylforma- mide (Sigma-Aldrich, Inc.) was added. The samples were then incubated overnight under 5% CO2 at 37°C. The optical density of the converted dye was measured at 510 nm by using a Labsystems Multiskan RC 96-well microplate reader (Thermo LabSystems, Inc., Massachusetts). Optical density was adjusted to 100% using the untreated cell groups, and the cell viability results were thus expressed as a percentage. The measurements were performed in triplicate. In this study, cell proliferation was determined by counting the number of viable cells in the individual wells by using the trypan blue exclusion test. Cells were treated with the extract or DMSO for 1, 3, 6, or 10 days. The medium was replaced every three days with fresh medium of the appropriate type. The study was performed in triplicate to obtain the average number of viable cells. The appearance of the cells was verifi ed by microscopic examination. Cell cycle analysis. After 72 hr, the proportion of cells in each of the cell cycles, (G1, S, and G2) was determined by staining the cell DNA with propidium iodide (PI). Briefl y, the cells were detached by trypsinization and washed twice with phosphate buffer sa- line (PBS without Ca2+ and Mg2+, PanTM Biotech GmbH) containing 2 mM of diso- dium ethylenadiamine tetracetic acid (Na EDTA). The cells were fi xed overnight with cold absolute ethanol and then stained with a solution containing 5 μl of PI (0.1 mg/ml, Sigma-Aldrich, Inc.), 1 μl of RNAse (1 mg/ml, Sigma-Aldrich, Inc.), and 49 μl of 2 mM Na EDTA in PBS. After 5-min incubation at room temperature in the dark, fl uorescent cells were sorted in a CytomicsTM FC 500 fl ow cytometry system equipped with a 488-nm argon laser (Beckman Coulter, Inc., California). The data were analyzed on the RXP software. EFFECTS OF THE EXTRACT ON PRODUCTION OF TYPE I PROCOLLAGEN AND MATRIX METALLOPROTEINASE-1 (MMP-1) BY HUMAN FIBROBLASTS Cells and treatment. Fibroblasts from cultures of the same explants as above (passage numbers of 5 to 7) were used in these experiments. Before being treated, the cell

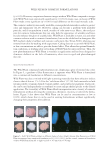
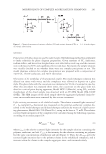
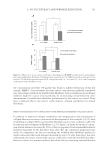
A. INCISUS EXTRACT AND WRINKLE REDUCTION 315 suspension was transferred from the 75-cm2 fl ask into 12-well plate at a density of 1×10⁵ cells/well of DMEM with FBS and antibiotics. The cells were incubated at 37°C for 24 h in a humid atmosphere containing 5% CO2. There were two groups of cultures: (i) serum-free DMEM + DMSO (0.1%, control group) and (ii) serum-free DMEM + extract (treated group). The cells continued to be incubated at 37°C with 5% CO2 for 72 h. Type I procollagen and MMP-1 assay. In this study, the procollagen assay used an antibody against the C-terminal propeptide region that is part of the transcribed collagen protein that is then proteolytically cleaved after secretion. Thus, this assay is a measure of newly synthesized collagen. After incubation with the extract for 72 h, the cell-free supernatant was collected, stored at −80°C, and then assayed later. The amount of type I procollagen was measured by using a commercial human procollagen type-I C-peptide EIA kit (Takara Bio Inc., Shiga, Japan). The same samples were also assayed for MMP-1 (interstitial collagenase) by using a commercial human MMP-1 ELISA kit (RayBiotech, Inc., Geor- gia, USA). The levels of type I procollagen and MMP-1 were normalized against a stan- dard dose-response curve based on the absorption at the wavelength of 450 nm using a Labsystems Multiskan RC 96-well microplate reader. The determinations were performed in triplicate. EFFECT OF THE EXTRACT ON CONTRACTION OF A FIBROBLAST-EMBEDDED COLLAGEN LATTICE Fibroblast-embedded collagen lattice preparation. A three-dimensional collagen lattice was prepared according to the previous studies (11,26) with modifi cation. Fibroblasts from nonwrinkled and wrinkled skin were collected from the same explants as mentioned above. Cells at passage 7 were used to prepare the fi broblast-embedded lattice. Briefl y, the disk-shaped matrix consisted of 1.98 ml of concentrated DMEM 1.96 X (GIBCOTM, In- vitrogenTM Life Technologies, California) containing 50 μg/ml of the extract (treated group) or 0.1% of DMSO (control group), 1.5 ml of rat tail type I collagen (Institut de Biotechnologies Jacques Boy, Reims, France), 0.25 ml of 0.1 N NaOH (Prolabo, Fon- tenay-Sous-Bois, France), 0.17 ml of 7.5% NaHCO3 (PanTM Biotech GmbH), 0.50 ml of FBS (PanTM Biotech GmbH), and 0.5 ml of cell suspension (8 × 10⁵ cells/ml). Matrices were prepared in 60-mm Petri dishes (Falcon bacteriological dishes, Elvetec Services, Clemont-Ferrand, France) and then placed in a 37°C incubator in a humid atmosphere containing 5% CO2. Matrix disks were prepared in triplicate for each group and experi- ments were performed in duplicate. Contraction capacity determination. The contraction capacity of the fi broblast-embedded lat- tice was visually determined from the lattice diameter. To measure matrix diameters, they were placed on a transparent metric ruler on a dark background. The matrix diameters were measured over the seven-day culture period. STATISTICAL ANALYSIS All quantitative data reported here are expressed as means of the samples for each treat- ment. Student’s unpaired t-test was used for comparison between the two groups. P 0.05 was considered signifi cant.
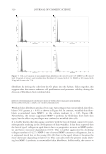
Purchased for the exclusive use of nofirst nolast (unknown)
From: SCC Media Library & Resource Center (library.scconline.org)