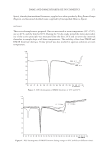
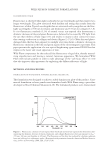
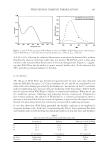
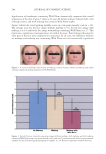
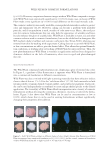
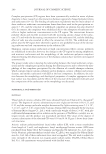
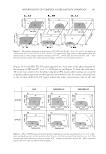
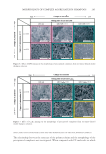
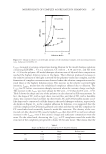
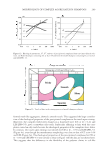
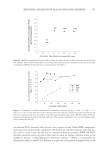
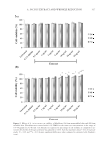
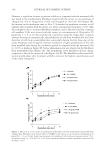
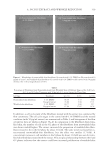
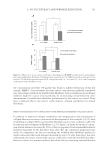
JOURNAL OF COSMETIC SCIENCE 318 However, a signifi cant increase in percent viability as compared with the untreated cells was found in the wrinkled-skin fi broblasts treated with the extract at concentrations of 10 μg/ml ( p 0.0.5), 20 μg/ml ( p 0.05), and 50 μg/ml ( p 0.01) for 24 h (Figure 2B). An increase in the incubation time to 48 or 72 h resulted in signifi cant increases in cell viability after treatment with the extract at a lower concentration (5 μg/ml, p 0.05). This effect might be due to increased fi broblasts numbers, and so this was tested by counting cell numbers. Cells were treated with the extract at concentrations of 20 μg/ml or 50 μg/ml for 1, 3, 6, or 10 days and directly counted by using the trypan blue exclusion method. Focusing on untreated cells, the proliferation of cells from wrinkled skin was lower than that of cells from nonwrinkled skin, particularly during the fi rst three days of the study. Treatment with 50 μg/ml of extract resulted in a higher proliferation of the cells from wrinkled skin during the incubation period as compared with the untreated cells ( p 0.05), as shown in Figure 3B. Such a phenomenon was not observed in the fi broblasts from nonwrinkled skin (Figure 3A). The morphology of the fi broblasts did not change compared to that of the untreated cells (Figure 4A–D). The fi broblasts still retained the typical spindle-shape after treatment with the extract at the highest concentration used in this study (50 μg/ml). Figure 3. Effects of A. incisus extract on proliferation of fi broblasts (A) from nonwrinkled skin and (B) from wrinkled skin. Fibroblasts were treated with 0.1% DMSO or the extract at concentrations of 20 μg/ml or 50 μg/ml for 1, 3, 6, or 10 days. Results are expressed as the number of cells. Each point represents mean ± S.D. of triplicate study *p 0.05 and **p 0.01 denote signifi cant differences when compared to untreated cells (Student’s t-test).

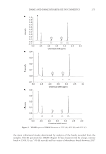
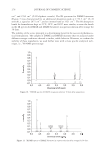
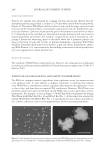
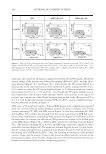
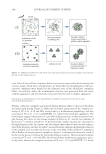
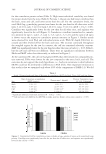
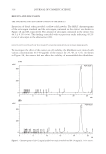
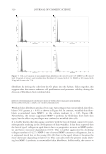
A. INCISUS EXTRACT AND WRINKLE REDUCTION 319 In addition, a cell cycle study of the fi broblasts treated with the extract was conducted by fl ow cytometery. The cell cycle stages in the control (with 0.1% DMSO) and the treated condition (with 50 μg/ml extract) are summarized in Table I, and histograms of the fl ow cytometric data are shown in Figure 5A–D. In comparison to the fi broblasts from wrin- kled skin, the number of cells in the G2 phase of the fi broblasts from nonwrinkled skin was about twofold higher. The extract increased the proportion of wrinkled-skin fi bro- blasts treated to be in the G2 phase by about 2.6-fold. The same trend was found for ex- tract-treated nonwrinkled-skin fi broblasts, but the effect was smaller (1.7-fold). A concomitant increase in cell numbers in the S phase by about 3.6-fold was seen for wrin- kled-skin fi broblasts treated with the extract. This reciprocal relationship between the S and G2 phases indicates that the extract could have increased proliferation of wrinkled-skin Figure 4. Morphology of nonwrinkled-skin fi broblasts (A) treated with 0.1% DMSO or (B) treated with 50 μg/ml of extract and wrinkled-skin fi broblasts (C) treated with 0.1% DMSO or (D) treated with 50 μg/ml of extract for 72 h (at magnifi cation of 10×). Table I Percentage of Fibroblasts from Nonwrinkled and from Wrinkled Skin at Different Stages of the Cell Cycle (G1, S, and G2) after Treatment with 50 μg/ml of A. incisus Extract for Three Days Cell type Treatment G1 (%) S (%) G2 (%) Nonwrinkled-skin fi broblasts 0.1% DMSO 86.59 3.53 9.88 50 μg/ml extract 76.80 5.99 17.21 Wrinkled-skin fi broblasts 0.1% DMSO 89.77 4.66 5.57 50 μg/ml extract 67.94 17.82 14.24
Purchased for the exclusive use of nofirst nolast (unknown)
From: SCC Media Library & Resource Center (library.scconline.org)