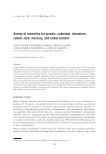
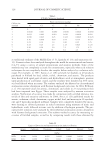
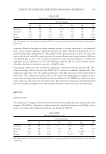
SURVEY OF COSMETICS FOR SEVEN INORGANIC ELEMENTS 135 SAMPLE DIGESTION PROCEDURE Prior to conducting the sample analyses, FDA asked Frontier to demonstrate reproduc- ible and accurate results for the seven analytes in seven reference lipsticks and four certi- fi ed reference materials with various matrices intended to mimic different cosmetic types (Conostan oil, marine sediment, tomato leaves, and fertilizer). This was done to demon- strate performance criteria for the limit of detection (LOD), limit of quantitation (LOQ), quality control (QC), and precision. The laboratory had previously performed analyses for FDA’s expanded study of lead in lipstick using the method developed and validated for that purpose (6,7). Frontier attempted to modify that digestion procedure to conduct the new analyses. However, they encountered diffi culties when the reported digestion proce- dure was applied to the new analytes and matrices. This prompted the development of a new sample preparation technique, described below. Sample digestions were performed in closed vessels with oven heating followed by re- peated evaporation (except for mercury analyses) of the acid mixture. The procedure used was as follows: • Weigh and transfer 0.5 ± 0.1 g analytical portion to a digestion vessel. • Add 25 ml of a 3:1 HNO3:HF mixture and 3 ml of HCl to the vessel. Table XIV. Elemental Results for 5 Compact Powders from 5 Manufacturers Manufacturer Brand Mean results (mg/kg)a As Cd Cr Co Pb Hg Ni A a 0.59 NF 16 4.4 6.8 0.0040 12 B a 0.28 NF 1.4 1.8 2.0 NF 3.9 C a 0.65 0.072 4.8 14 1.6 NF 28 E a 0.66 NF 11 0.82 7.8 TR 6.0 U a 0.34 NF 4.7 3.0 0.36 NF 8.7 NF: Not found, or less than detection limit TR: Trace, or greater than detection limit, but less than quanti- tation level. a Mean results of duplicate determinations. Table XV. Elemental Results for 5 Shaving Creams from 4 Manufacturers Manufacturer Brand Mean results (mg/kg) As Cd Cr Co Pb Hg Ni B c Product 1 NF NF 0.50 NF TR NF NF B c Product 2 TR NF 0.21 NF NF NF TR U a NF NF TR NF TR NF 0.13 CC b NF NF NF NF NF NF NF GG a TR NF TR NF NF NF NF NF: Not found, or less than detection limit TR: Trace, or greater than detection limit, but less than quanti- tation level. a Mean results of duplicate determinations.

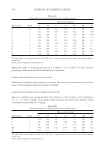
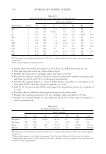
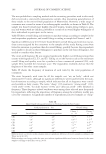
JOURNAL OF COSMETIC SCIENCE 136 • Seal and heat the vessels in an oven at 130°C for 12 h. Allow the vessels to cool. • Vent and open the vessels in a fume exhaust hood. • Transfer the solutions to centrifuge tubes and dilute to 50 ml. • For mercury analyses, transfer 4 ml of the analytical solution to another centrifuge tube and dilute to 40 ml with 5% (v/v) bromine monochloride. • Transfer the original digests to cleaned Tefl on beakers and heat on a hot plate at no more than 200°C until the volume is reduced to 2–3 ml. • Add 25 ml of concentrated HNO3 and repeat the evaporation process to a volume of 2–3 ml. • Continue the acid addition and evaporation process two more times. • Transfer the resultant solutions to 50 ml centrifuge tubes and dilute to 50 ml. • Include two method blanks in each digestion batch of no more than 20 samples to assess contamination. Table XVI. Elemental Results for 10 Face Paints from 10 Manufacturers Manufacturer Brand Mean results (mg/kg)a As Cd Cr Co Pb Hg Ni HH a 0.49 NF 4.2 0.52 4.0 NF 1.9 II a 0.22 NF 15000 1.8 0.35 TR 12 JJ a 0.55 0.15 1.3 0.096 0.24 0.0040 0.60 KK a 0.31 NF 2.2 0.16 1.9 NF 0.50 LL a 0.42 NF 3.1 0.66 0.35 TR 3.4 MM a TR NF 0.26 0.092 0.39 TR 0.17 NN a 1.4 TR 1.3 0.12 1.4 TR 0.64 OO a 0.24 NF 39 10 0.80 NF 24 PP a 0.21 NF 0.51 0.20 0.31 NF 0.50 QQ a 0.25 NF 14 0.53 0.49 NF 2.7 NF: Not found, or less than detection limit TR: Trace, or greater than detection limit, but less than quanti- tation level. a Mean results of duplicate determinations. Table XVII. Eye Shadow Summary (n = 30) Results (mg/kg) As Cd Cr* Co** Pb Hg Ni** Maximum 1.7 0.36 22000 64 (13) 14 0.040 1600 (42) Minimum NF NF 1.1 0.11 0.045 NF 0.91 Mean 0.50 0.032 940 5.5 (3.5) 4.2 0.0068 65 (12) Median 0.43 NF 11 2.6 (2.4) 4.0 0.0025 9.8 (9.6) NF: Not found, or less than detection limit TR: Trace, or greater than detection limit, but less than quanti- tation level. *Three samples appear to use chromium pigments, thus the large difference between mean and median. **Signifi cantly high values of 1600 mg/kg for Ni and 64 mg/kg Co from one sample were removed for the calculated values in parentheses.
Purchased for the exclusive use of nofirst nolast (unknown)
From: SCC Media Library & Resource Center (library.scconline.org)