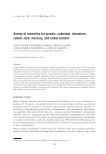
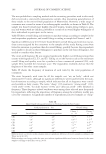
SELECTION OF FRAGRANCE FOR COSMETIC CREAM CONTAINING OLIVE OIL 165 Cluster analysis. Hierarchical cluster analysis of overall liking data enabled the identifi ca- tion of two consumer groups with different overall attitudes toward the tested products. The formation of clusters was based on Ward’s aggregation criterion and the calculation of Euclidean distances between data points. The chi-square statistical test was performed to determine signifi cant differences (p ≤ 0.05) in the distribution frequency of sociodemo- graphic variables and in cosmetic cream consumption frequency between clusters. An ANOVA was conducted on overall liking, considering sample, cluster, and a combi- nation of the two, as variation factors. Mean ratings and honestly signifi cant differences were determined based on the Tukey test (p ≤ 0.05). For the CATA questions, frequency of mention was determined for each term and cluster, and Cochran’s Q test was carried out for each term to determine whether the consumers in the two clusters used the terms in signifi cantly different ways. Finally, correspondence analysis—a descriptive/exploratory technique designed to ana- lyze simple two-way contingence tables showing a certain degree of correspondence be- tween rows and columns—enabled a spatial representation of the data, refl ecting the relationship between the stimuli and the elicited concepts (23). XL-Stat 2012 (Addinsoft, New York, NY) was used to conduct the above analysis. RESULTS AND DISCUSSION Table II shows the sociodemographic characteristics of respondents and the frequency of cosmetic cream use among these consumers. Table II Sociodemographic Characteristics and Cosmetic Cream Use Frequency (n = 63) Age (years old) ≤35 28 (44.4%) Over 35 35 (55.6%) Education level Secondary education completed 18 (28.6%) Partial tertiary education 19 (32.2%) University graduates 26 (41.2%) Marital status Lives with a partner 18 (28.6%) Lives alone 45 (71.4%) Number of persons in the household 1–2 34 (54.0%) 3 or more 29 (46.0%) Number of children in the household 0 52 (82.5%) 1 or more 11 (17.5%) Face cream use frequency Occasional use 12 (19.0%) Frequent use 39 (62.0%) Always uses 12 (19.0%) Body cream use frequency Occasional use 17 (27.0%) Frequent use 39 (61.9%) Always uses 7 (11.1%)

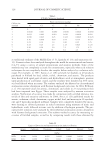
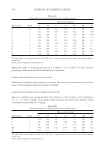
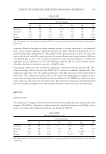
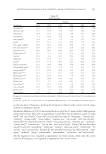
JOURNAL OF COSMETIC SCIENCE 166 The non-probabilistic sampling method and the recruiting procedure used in this study did not provide a statistically representative sample, thus preventing generalization of these results to the entire female population of Montevideo. However, a wide range of consumers was covered in terms of sociodemographic variables, as shown in Table II. The sample was biased toward more highly educated women, women living without a part- ner, and women with no children, probably as a result of an overall higher willingness of these individuals to participate in the survey. Table III shows overall liking and intention to purchase ratings according to sample for the total respondent population, and overall liking according to sample for Clusters 1 and 2. Signifi cant differences (p ≤ 0.05) were found between overall liking and intention to pur- chase scores assigned by the consumers to the samples of this study. Rating scores were lower for intention to purchase than for overall liking, possibly because the respondents were unable to decide on their willingness to purchase on the sole basis of fragrance, but needed to consider other factors. The cream with fragrance E4 was assigned signifi cantly higher overall liking ratings than creams with fragrances E2, E3, and E5. Taking six on the 9-point scale as the minimum overall liking and quality score for a product to have commercial potential (24), only sample CE4 exceeded the minimum score. The respondents evidently did not like the fragrances of the other cream samples. Table IV shows the frequency of mention of each term by the total population of consumers. The most frequently used term for all the samples was “use on body,” which was mentioned 167 times, although no signifi cant differences were found between the num- ber of mentions according to sample, which indicates that all six fragrances were consid- ered suitable as body creams. The terms “cheap” (116 mentions), “strong smell” (112), “mild smell” (109), “for older women” (109), and “delicious smell” (103) followed in frequency. Three fragrance-related attributes were among those selected most frequently by respondents, refl ecting the importance of fragrance among the attributes readily per- ceived by consumers. A signifi cant number of respondents perceived samples as “cheap” Table III Mean Overall Liking and Intention to Purchase Scores (9-Point Scales) Sample Total population (n = 63) Overall liking Overall liking Intention to purchase Cluster 1 n = 22 Cluster 2 n = 41 CE1 5.2a,b 4.6b 5.1b A 5.3a,b A CE2 4.9b 4.4b 6.5a,b A 4.1b,c B CE3 5.0b 4.5b 6.2a,b A 4.4a,b,c B CE4 6.2a 5.7a 7.3a A 5.6a B CE5 4.8b 4.4b 6.2a,b A 4.0c B CE6 5.6a,b 4.8a,b 5.8b A 5.4a A Different lower case letters within columns indicate signifi cant differences between samples according to the Tukey test (p ≤ 0.05). Different upper case letters within the same row indicate signifi cant differences between clusters for the same sample according to the Tukey test (p ≤ 0.05).
Purchased for the exclusive use of nofirst nolast (unknown)
From: SCC Media Library & Resource Center (library.scconline.org)