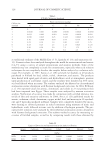
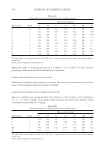
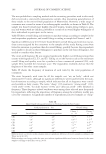
FACTORS AFFECTING SPF AND PA VALUES OF SUNSCREEN CREAM FORMULATIONS 153 Table V Corrected SPF and PA Values of Test Samples Sample SPF (cal) ± S.D. PPD ± S.D. PA (cal) F1 21.81 ± 4.28 4.45 ± 1.51 2+ F2 29.27 ± 2.75 6.59 ± 1.62 2+ F3 38.54 ± 3.11 6.57 ± 0.73 2+ F4 53.82 ± 5.41 9.78 ± 1.83 3+ F5 60.68 ± 10.89 11.99 ± 1.83 3+ F6 26.05 ± 4.35 6.72 ± 2.30 2+ F7 40.18 ± 5.73 7.17 ± 1.78 2+ F8 32.92 ± 2.3 6.05 ± 0.39 2+ F9 30.98 ± 2.43 6.83 ± 0.51 2+ RESULTS As shown in Table V, SPF and PA values of F1, F5, and F4 were 21.81/2+, 60.68/3+, and 53.82/3+, respectively. F5 and F4 appeared to have good protection against UVB and UVA. The difference between F5 and F4 was the PVR and the presence of xanthan gum. When comparing the components in F1, F5, and F4 (Tables II and III), it was found that F1 contained a low level of PVA, had no xanthan gum, and a low level of stearic acid, whereas F5 contained a low level of PVR with an absence of xanthan gum and a high level of stearic acid and F4 contained a high level of PVR and xanthan gum with low stearic acid. The formulations having high levels of PVR and xanthan gum with low levels of stearic acid (F4) appeared to possess SPF values of 53.82, which was greater than the formulation containing low levels of PVR and stearic acid with high levels of xanthan gum (F3) hav- ing an SPF value of 38.54. This indicates that formulations having a higher level of PVR and xanthan gum can improve the SPF values. In contrast, if the level of xanthan gum was low and stearic acid was high, the formulation that contains a low level of PVR (F5) was found to have an SPF value of 60.68, which was much greater than the formulation con- taining a high level of PVR (F5), which had the SPF value of only 26.05. This indicates that there is an interaction between PVR and the amount of stearic acid. Table IV SPF and PA Values Labeled on the Reference Products in Comparision with Their Corrected Values from Equation (1) and PA Grading Values from Equation (2) Sample SPF (cal) ± S.D. SPF (labeled) PPD ± S.D. PA (cal) PA (labeled) SPF 4.47 1.92 ± 0.52 4.47 – – – SPF 15 14.36 ± 2.61 15 3.53 ± 0.20 2+ – S1 12.97 ± 2.07 30 5.29 ± 0.47 2+ 2+ S2 44.19 ± 3.50 40 9.91 ± 1.02 3+ – S3 42.48 ± 8.16 50 8.37 ± 1.83 2+ 3+ S4 46.15 ± 10.23 50 15.45 ± 1.51 3+ 3+ S5 58.25 ± 0.85 60 15.12 ± 1.36 3+ 3+ S#: Sample number from a counter-brand sunscreen product.

JOURNAL OF COSMETIC SCIENCE 154 F5 and F4 appear to have good protection against UVB and UVA. Even though a high level of PVR could signifi cantly increase the SPF value, the high level of stearic acid sig- nifi cantly affected the SPF value more than the PVR did. However, due to the interaction between PVR and stearic acid, the high level of PVR and stearic acid (F6) caused a sig- nifi cant lowering of the SPF value, while a low level of PVR and a high level of stearic acid (F5) resulted in an increase in the SPF value (Tables II and V). In addition, adding xanthan gum to F5 could improve the SPF value (F7), but not as effectively as that of F5. Regression analysis revealed that all three factors which were PVR and the concentrations of xanthan gum and stearic acid signifi cantly affected the calculated SPF values. It should be noted that interaction between PVR and xanthan gum possessed a positively signifi - cant effect on the SPF value. In contrast, interaction between PVR and stearic acid, and xanthan gum and stearic acid caused a negatively signifi cant effect on the SPF values. All three factors affected the texture profi les of the tested products (Table VI). Although PVR caused a positively signifi cant effect on the product hardness, it had a negatively signifi cant effect on their adhesiveness. In addition, the amount of stearic acid in the for- mulations caused a negatively signifi cant effect on the product hardness and compress- ibility but it caused a positively signifi cant effect on the product adhesiveness. Nevertheless, the interaction effect between xanthan gum and stearic acid caused a nega- tive effect on the hardness and compressibility of the formulations, while it caused a positive effect on their adhesiveness. Except for interaction between PVR and xanthan gum, it was found that all factors signifi cantly increased the pH of the formulation, whereas the interaction between the main factors significantly decreased pH of the products. Figure 3 shows the stability of tested formulations after undergoing freeze-thaw cycling. Except for cohesiveness, the texture profi les of F6–F9 were unstable. The pH of F1–F3 and F6 were signifi cantly decreased, whereas the viscosity of F3, F6, F8, and F9 were signifi cantly increased. DISCUSSION The variability of COLIPA SPF values depends on the skin type variations of the volun- teers. Therefore, 20% deviation of SPF values is acceptable for the requirements of the international standard of SPF test methods (24). Bendova et al. (1) demonstrated that methods of SPF in vitro testing showed great differences from SPF determination by the COLIPA method of in vivo testing because the high variability of in vitro SPF values de- pends on substrate selection and product application technique. Kelley et al. (9) found that there was limitation to using Transpore® tape due to its perforation. In this study, the Transpore® tape was modifi ed by sticking transparent tape on one side and applying the sample on the rough side. With this modifi cation, the variation of obtained SPF val- ues appears to be less than 20% deviation, and the test sample was quite uniformly dis- tributed over the plate. In this study, the SPF values, calculated according to a study of Diffey and Robson (6), were less than the labeled SPFs of the majority of counter-brand sunscreen products and the standard sunscreen products, SPF 4.47 and SPF 15. The re- sults of this fi nding were similar to a study of Sheu et al. (15). However, linear regression analysis showed that there was a good correlation between calculated SPF values and la- beled SPF values at a coeffi cient of determination of 0.901. As a result, the calculated SPF
Purchased for the exclusive use of nofirst nolast (unknown)
From: SCC Media Library & Resource Center (library.scconline.org)