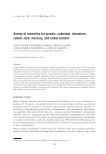
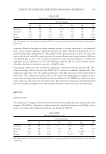
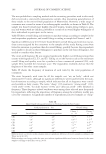
STABILITY OF UREA IN SOLUTION AND PHARMACEUTICAL PREPARATIONS 189 10 min, the absorbance of the solution was measured at 422 nm against a reagent blank. The experiments were performed in triplicate, and mean concentrations were used for determination of rate constants. DETERMINATION OF UREA DEGRADATION RATE CONSTANTS IN NON-AQUEOUS SOLVENTS The 2.5% urea solutions with various non-aqueous solvents including propylene glycol, glycerol, ethanol, isopropanol, pentylene glycol, and polyethylene glycol were prepared and incubated at 25° and 40°C. The urea concentration values at defi ned temperature values and different time intervals of 3, 7, and 14 days were determined as per the follow- ing procedure. A solution (0.5 ml) containing 4% (w/v) of p-DMAB and 4% (v/v) sulfuric acid in 99% ethanol was added to the mixture of 0.05 ml of urea solution and 4.95 ml of 99% ethanol. After 10 min, the absorbance of the solution was measured at 422 nm against a reagent blank. The experiments were performed in triplicate, and mean concentrations were used for determination of rate constants. DETERMINATION OF UREA DEGRADATION RATE CONSTANTS IN PHARMACEUTICAL PREPARATIONS Pharmaceutical preparations composed of urea at varying concentrations of 2.5%, 5%, 10%, 15%, and 20% (w/w) were prepared using the ingredients shown in Table I. For water phase, ingredients were mixed and heated to 80°C, and then urea was added and Table I Ingredients of urea-containing pharmaceutical preparations Ingredients Urea concentration 2.5% 5% 10% 15% 20% Water phase Glycerol 85% 3.50 g 3.50 g 3.50 g 3.50 g 3.50 g Magnesiumsulfate-Heptahydrate 0.50 g 0.50 g 0.50 g 0.50 g 0.50 g Lactic acid solution 9% 1.56 g 1.56 g 1.56 g 1.56 g 1.56 g Sodium lactate solution 50% 1.72 g 1.72 g 1.72 g 1.72 g 1.72 g DI-water 29.27 g 28.02 g 25.52 g 23.02 g 20.52 g Urea 1.25 g 2.50 g 5.00 g 7.50 g 10.00 g Oil Phase Caprylic/capric triglyceride (Myritol 318 PH®) 5.00 g 5.00 g 5.00 g 5.00 g 5.00 g Decamethylcyclopentasiloxane (Cyclomethicone 5-NF®) 1.25 g 1.25 g 1.25 g 1.25 g 1.25 g Cetearyl ethylhexanoate/isopropyl myristate (PCL®) 1.25 g 1.25 g 1.25 g 1.25 g 1.25 g Hexyldecanol/hexyldecyl laurate (Cetiol® PGL) 2.00 g 2.00 g 2.00 g 2.00 g 2.00 g Polyglyceryl-3 diisostearate (Lameform® TGI) 0.84 g 0.84 g 0.84 g 0.84 g 0.84 g Polyglyceryl-2 dipolyhydroxystearate (Dehymuls®) 1.66 g 1.66 g 1.66 g 1.66 g 1.66 g Caprylyl Glycol/ethylhexylglycerin (Sensiva® SC10) 0.20 g 0.20 g 0.20 g 0.20 g 0.20 g

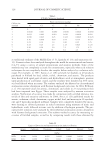
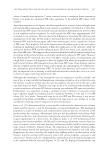
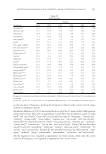
JOURNAL OF COSMETIC SCIENCE 190 dissolved to get the pH 4.30–4.70. The oil phase was separately heated to 80°C. Water phase was then added to oil phase while stirring. The mixture was homogenized at 65°C for 1 min and was cooled down to 25°C while further stirring. Pharmaceutical prepara- tions composed of urea at varying concentrations of 2.5%, 5%, 10%, 15%, and 20% (w/w) were separated into two groups: pH 4.50 (no further pH adjusting) and pH 6.00 (adjusting with lactate buffer). The urea preparations at different concentrations and pH values were incubated at 25° and 40°C. The residual urea concentration values at a de- fi ned pH and temperature values and different time intervals of 3, 7, and 14 days were determined as per the following procedure. The sample of 1 g urea preparation was diluted to 20 ml with 80% ethanol. The mixture was heated and stirred on a water bath at 70°C for 5 min until dispersed and placed for 30 min at room temperature on a mechanical stirrer. The sample was then centrifuged for 5 min at 8000 rpm at 4°C and fi ltered through a 0.2 mm fi lter (Chromafi lm® Macherey- Nagel, Düren, Germany). The fi ltrate (0.05 ml) was diluted with the same solvent to 5 ml. A solution (0.5 ml) containing 4% (w/v) of p-DMAB and 4% (v/v) sulfuric acid in 99% ethanol was added to the mixture. After 10 min, the absorbance of the solution was measured at 422 nm against a reagent blank. The experiments were performed in tripli- cate, and mean concentrations were used for determination of rate constants. RESULTS AND DISCUSSION THE KINETICS OF UREA DEGRADATION IN AQUEOUS SOLUTIONS Urea solutions at different concentrations (2.5%, 5%, and 10% [w/v]), pH (3.11–3.36, 4.08–4.19, 6.43–7.36, 8.40–8.59, 9.40–9.67, 4.5, and 6.0 with lactate buffer, 6.0 with phosphate buffer, and 6.0 with citrate buffer), and temperature values (25°, 40°, and 60°C) were used to determine the effect of concentration, pH, and temperature on the stability of urea. The linear regression of the decomposition data shows that urea degradation reaction obeys fi rst-order kinetics at all measured pH and temperature values of the experiments. Table II demonstrates the values of the rate constant, k, in h−1 calculated from the experimental data of the residual urea concentrations with various initial concentrations of 2.5%, 5%, and 10% as a function of pH and temperature. The values of the urea degradation rate constant are in the same magnitude of those reported by previous investigators (8). Within the ex- perimental range of temperature and initial urea concentration values, the lowest urea deg- radation was performed at pH 6.43–7.36. There was no signifi cant difference between various buffers, but lactate buffer pH 6.0 showed the minimum degradation rate constant. Degradation rate constant slightly decreases as the initial urea concentration is increased. Since more ammonium cyanate was produced (in the same time interval) at the higher urea concentration than at the lower ones, this was tentatively attributed to the reverse reaction, thus lowering the urea degradation. The results obtained are in accordance with this argumentation and indicate that the reverse reaction is important when as little as 5% of the urea present initially has decomposed. The obtained result for the decomposition rate constant at the temperature range of 25°–60°C shows that urea is quite stable in the pH range between 4 and 8 than out of this
Purchased for the exclusive use of nofirst nolast (unknown)
From: SCC Media Library & Resource Center (library.scconline.org)