EFFECT OF CYCLOHEXANE AND BENZENE DIESTER ON MELANOGENESIS 179 sodium deoxycholate, 0.1% SDS, 0.15 NaCl, 0.01 M sodium phosphate [pH 7.2], 2 mM EDTA, 50 mM sodium fl uoride, 0.2 mM sodium orthovanadate, 1 mM phenylmethylsulfonyl fl uoride, 1 μg/ml aprotinin, and 1 μg/ml leupeptin) for 30 min on ice. Following incubation, the cell lysates were cleared by centrifugation at 15,000 rpm for 30 min, and the resultant supernatants were collected and used to estimate protein concentration by a Bradford assay (15). Then, 10 μg of total protein lysates were resolved on 10% sodium dodecyl sulfate poly- acrylamide gels (SDS-PAGE) the separated proteins were transferred to the PVDF mem- brane. The level of protein expression in each sample was detected using specifi c primary antibodies, diluted in a TBST solution (Tris-Bufferd Saline and Tween 20) containing 5% (w/v) of skim milk or 3% (w/v) of bovine serum albumin. The membranes were incubated with a specifi c HRP-conjugated secondary antibody and developed using the enhanced che- miluminescent substrate from West zol-plus. Then, they were stripped and reproved with a β-actin primary antibody as a protein loading control. REVERSE TRANSCRIPTION-POLYMERASE CHAIN REACTION The total RNA was extracted from B16F10 cells by using the Trizol reagent (Invitrogen, Carlsbad, CA). After the synthesis of cDNA with oligo d(T)15 as a reverse transcriptase primer with the extracted RNA as template, PCR amplifi cation was performed using a GenePro Thermal Cycler (Bioer Technology Co., Ltd, Hangzhou, China). The oligonucleotide primers included (i) tyrosinase: 5ʹ-GGG CCC AAA TTG TAC AGA GA-3ʹ (upstream) and 5ʹ-GGC AAA TCC TTC CAG TGT GT-3ʹ (downstream) (ii) TRP-1: 5ʹ-AGG AAT CTG GCT TGG GAT TT-3ʹ (upstream) and 5ʹ-ATG AGC CAC AAG GGT CAG TC-3ʹ (downstream) (iii) TRP-2: 5ʹ-AGC AGA CGG AAC ACT GGA CT-3ʹ (upstream) and 5ʹ-CAG GTA GGA GCA TGA TAG GC-3ʹ (downstream) and (iv) GAPDH: 5ʹ-AAC TTT GGC ATT GTG GAA GG-3ʹ (upstream) and 5ʹ-ACA CAT TGG GGG TAG GAA CA-3ʹ (downstream). The yields of cDNA represented approximately 3 μg of the total input RNA. The reaction was carried out for 35 cycles for 30 s at 94°C, 30 s at 52°C (TRP-1, GAPDH)/53 (TRP-2, tyrosinase), and 30 s at 72°C. The reaction mixtures were analyzed by electrophoresis using 1% agarose gels that were further stained with ethidium bromide. The intensity of the bands was measured using GeneTools software (Syngene, Cambridge, UK). STATISTICAL ANALYSIS Mean ± SEM (standard error of the mean) were calculated. Statistical analyses of the results were performed using the t-test for independent samples. p 0.05 was considered signifi cant. A TYROSINASE INHIBITOR MODEL FOR STRUCTURE-BASED DRUG DESIGN Structure-based drug design is used in assessing changes in protein structure and the interac- tions (docking) between small-molecule organic compounds. This technique is also employed in the development of new drugs through the use of molecular dynamics. This study investigated the interactions and the mechanism of whitening by using a tyrosinase inhibitor model and a whitening-derivatives model, the latter being selected based on its whitening effect at the cellular level.

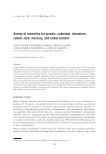
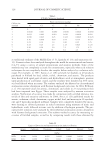
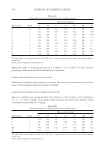
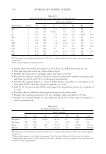
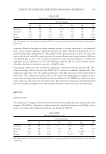
JOURNAL OF COSMETIC SCIENCE 180 To examine the tyrosinase x-ray crystal structure as a receptor, fi ve tyrosinase structures of Bacillus megaterium and Streptomyces castaneoglobisporus (protein data bank [PDB] ID: 3NM8, 3NQ1, 1WXC, 2ZWD, 3AWS) were downloaded from the RCSB PDB, and the protein se- quences were compared. A homology modeling analysis was performed using the modeler (University of California, San Francisco, CA) focusing on the locations with similar protein sequences. Docking was designed considering the structure of human tyrosinase, which was created by homology modeling using AutoDock Tools (The Scripps Research Institute, La Jolla, CA). Through this program, docking of ligand and target protein was simulated using 3D grid box. The structures of the whitening derivative molecules were generated using the software Cornica (Molecular Networks GmbH, Erlangen, Germany). The process of docking was simulated using the following steps (the same procedure was performed for studying ar- butin, another tyrosinase inhibitor): • Converting 2D structures of whitening derivatives and arbutin into 3D structures. • Calculating polarities and eliminating water molecules. • Attaching hydrogen molecules to polar molecules and identifying the location where the ligand of the protein attaches. • Proceeding with the simulation by using the AutoDock tools. RESULTS INHIBITORY EFFECTS OF CYCLOHEXANE DIESTER DERIVATIVES (1A–1O) AND BENZENE DIESTER DERIVATIVES (2A–2O) ON MUSHROOM TYROSINASE ACTIVITY The mushroom tyrosinase inhibitory activities of cyclohexane diester and benzene diester de- rivatives were determined using L-DOPA as a substrate. These diester compounds were as- sayed at a variety of concentrations. However, all compounds showed no inhibitory activities (data not shown). STRUCTURE–CYTOTOXICITY RELATIONSHIPS OF CYCLOHEXANE DIESTER DERIVATIVES (1A–1O) AND BENZENE DIESTER DERIVATIVES (2A–2O) ON B16F10 CELLS In an endeavor to identify the structure–cytotoxicity relationships between cyclohexane dies- ter derivatives and benzene diester derivatives in the B16F10 cells, the levels of cytotoxicity were observed in various diester locations (i.e., 1,2-, 1,3-, 1,4-) and by the changing chain length of the acyl group. The cytotoxicity test results in Table II suggest that, at the concentration of 500 μM, the cy- totoxicity of 1,2-cyclohexane diester derivatives and 1,3-cyclohexane diester derivatives in- creased as the carbon number of the side chain went up. On the other hand, the cytotoxicity of 1,4-cyclohexane diester derivatives tended to decline with the carbon number of the side chain on the rise. In the case of 1,2-benzene diester derivatives, their cytotoxicity decreased with the carbon number of the side chain going up, but then it started increasing from the time when the carbon number of the side chain reached 10 onward. For 1,3-benzene diester derivatives and 1,4-benzene diester derivatives, their cytotoxicity grew lower with an increase in the carbon number of the side chain.
Purchased for the exclusive use of nofirst nolast (unknown)
From: SCC Media Library & Resource Center (library.scconline.org)