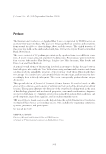
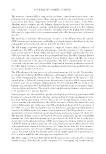
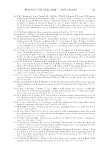
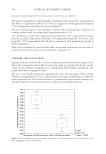
JOURNAL OF COSMETIC SCIENCE 350 HAIR FATIGUE MEASUREMENTS Hair treatments were performed on 4 g 8″ chemically treated hair switches sourced from International Hair Importers & Products, Inc. Fibers were cut from the middle of the tress and ends crimped at 30 mm using a Dia-stron Auto-Assembly System (AAS 1600) (Andover, Hampshire, UK). The average cross-sectional area along each fi ber was analyzed using a Dia-Stron Fiber Dimensional Analysis System (FDAS 770), which incorporates a Mitutoyo laser micrometer (LSM-6200) (Malborough, MA). The average cross-sectional area was calculated from three diameter measurement points along each 30-mm crimped fi ber. The average cross-sectional values for each of the fi bers were then used to set the Dia-Stron Cyclic Tester (CYC801) in controlled stress mode of 0.014 g/μm2 and rate of 40 mm/s. Environmental testing conditions were set at 50% RH and 23°C. Data were analyzed by Weibull and Kaplan–Meier statistical tools (JMP Pro 12.1.0, SAS, Cary, NC). Fibers with break cycles less than 10 were omitted from the analysis because of premature breakage. RESULTS AND DISCUSSION As we consider internal structural lipids one important question is how to quantify their levels in hair. There have been several reports in the literature (4,5) but often the data is confl icting, due in part to inherent variability in hair and in part to different extraction methods used. In this work, we developed a method using a three-stage extraction. Stage one is a hexane extraction designed to remove any surface lipids, stage two is extraction using chloroform method to extract internal unbound lipids and stage three is a hydroly- sis with KOH/methanol followed by an extraction with chloroform:methanol to extract the remaining lipids. The original intent was to use the second extraction to access un- bound lipids and the third to access bound lipids but this proved not to be possible. In- stead, 18-MEA was used as a marker for bound lipids and extraction conditions were optimized to give readily extractable unbound lipids in the second extraction and the remainder in the third extraction. Figure 1 shows data from virgin blended hair as sup- plied by International Hair Importers. Most lipids are saturated and unsaturated fatty acids with C16 and C18 chain lengths predominating, but cholesterols and ceramides were also measured. These results are comparable with those published by Masukawa et al. (6) in 2005, where a similar extraction protocol was used. These lipids are typically visualized using transmission electron microscopy but in this work confocal fl uorescence optical Fi gure 1. Internal structural lipids in hair.

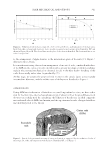
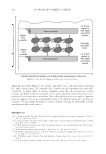
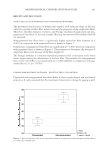
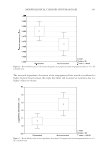
INTERNAL LIPIDS IN HAIR HEALTH 351 microscopy was used to avoid sampling artefacts. Hair was treated with Nile Red and then imaged via confocal fl uorescence microscopy in a glass capillary tube that was held vertically to enable imaging of hair cross sections in the x–y plane to give optimal spatial resolution. Nile Red only fl uoresces when associated with lipid structures and in Figure 2 this provides contrast for the hair images. Lipids are seen in the cuticle CMC and cortex CMC and highlights that these structures form a continuous network throughout hair. Areas of more intense contrast are seen in the medulla and in nuclear remnants, indicat- ing high lipid concentrations in these regions. Studies have measured changes in structural internal lipids, especially after repeated washing or coloring (3). Figure 3 shows loss of internal lipids from root to tip. Table I shows loss of internal lipids after 100 washes with a clarifying shampoo for both uncolored virgin hair and hair that had undergone fi ve cycles of coloring with an ammonia/hydrogen peroxide colorant, with fi ve wash cycles in between each coloring. Both coloring and washing remove lipids from hair and especially fatty acids. Coloring also signifi cantly decreases unsaturated fatty acid levels (~40%). It is proposed that the loss of these un- saturated lipids during coloring is because of the formation of LPOs, which can either remain in hair or undergo further oxidation, e.g. in the presence of redox metals, such as copper, to form reactive oxygen species (ROS)—see Figure 4. Experiments were carried out with eight single source-untreated virgin ponytails, where initial LPO measurements were compared with LPO levels after treating, with an ammonia/hydrogen peroxide (4.5%) colorant with very low oxidative dye levels for 30 min. All the ponytails were 25–30 cm long, Caucasian hair that had not previously been colored, and all were ap- proximately the same color (23–25 L units). To measure LPOs, hair was extracted with chloroform/methanol at room temperature and the extract measured using a LPO kit from KAMIYA Biomedical Company. In the presence of hemoglobin, LPOs are re- duced to hydroxyl derivatives (lipid alcohols) and the 10-N-methylcarbonyl-3,7- bis(dimethylamino)phenothiazine chromogen is oxidatively cleaved to form methylene blue in an equal molar reaction. LPOs are then quantitated by colorimetrically measur- ing methylene blue at 675 nm. Figure 5 shows initial LPO data from starting substrates Fig ure 2. Confocal fl uorescence microscopy image of hair stained with Nile Red dye.
Purchased for the exclusive use of nofirst nolast (unknown)
From: SCC Media Library & Resource Center (library.scconline.org)