JOURNAL OF COSMETIC SCIENCE 306 the long axis (5), this method also lacks the ability to distinguish among the fi ne subcom- ponents but may offer data on cuticle contribution (6). Atomic force microscopy (AFM), since its emergence (7), has enabled higher spatial reso- lution. This has made AFM the ideal tool for investigating the mechanics of the hair subcomponents (8,9). Moreover, AFM nanoindentation is able to measure the mechanics of the hair subcomponents in any direction. Acquiring the mechanical response of the same subcomponent along different axes has, so far, not been performed, however, by other investigators. This study aims to explore this aspect, expecting that such data pro- vide new hints about hair architecture. MATERIALS AND METHODS HAIR SAMPLES Virgin hairs were collected from a European female, close to the root, and washed. The washing process consisted of sonication of the hairs in 1% aqueous sodium dodecylsul- phate (50 cm3) for 1 min, sonication in deionized and UV irradiated water (50 cm3) for 1 min, followed by rinsing with copious amounts of the same and, fi nally, gentle drying under a stream of nitrogen. AFM All AFM measurements were performed in a closed cell under controlled relative humid- ity, RH, which can be adjusted to the intended value ±1%, and a temperature of 25 ± 1°C, using a MFP-3D Scanning Probe Microscope (Asylum Research, Santa Barbara, CA). Samples were equilibrated for 1 h before each measurement. Fibers were embedded in Epon 812 resin (TAAB Laboratories Equipment Ltd., Aldermaston, Berkshire, UK) and, after curing, excess epoxy material was removed from around the embedded hair with a razor blade, and the top 2 mm of the resin block, containing the hair sample, was severed and mounted on a steel AFM sample stub with silver paint, ensuring that the hair samples were perpendicular (for cross sections) or parallel (for longitudinal sections) to the sample stub. Smooth hair sections were then exposed by ultramicrotome (Reichert Ultracut N Ultramicrotome, Wien, Austria), using a diamond knife (Ultra 45, Diatome Ltd., Biel, Switzerland). Force curves and corresponding images on hair sections were acquired using a rectangular silicon nitride cantilever of length and nominal spring constant, k, 160 μm and 42 N m-1, respectively (Olympus Corp., Tokyo, Japan). The anatomy of force curves and the extrac- tion of nanoindentation data have been described elsewhere (10). To overcome the uncertainty in knowing the tip radius, necessary for evaluating the samples elastic moduli, five polymer samples, listed in Table I, with known Young’s moduli, E, and Poisson’s ratios, υ, were measured, as a means of indirectly calibrating the AFM system (11). Approximately, 2 × 2 mm pieces of each polymer were embedded in Epon 812 resin, mounted, and cut by ultramicrotome, in the same manner as for the hair samples.

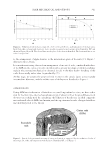
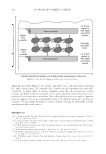
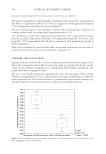
HAIR MECHANICAL ANISOTROPY 307 To acquire force curves, the AFM was operated in indentation mode, using a low trig- ger value (0.01 V) to detect the sample surface. Then an indentation of fi xed depth (maximum 25 nm, indentation rate 50 nm s-1) was performed. Using the Force Map mode of the AFM it was possible to obtain 196 force curves from 14 × 14 arrays, on 2 × 2 μm regions of the cortex of the hairs. A similar process was carried out for the polymer standards. For the cuticle regions, manual selection of the position of each force curve using the AFM software was performed. Using the polymer reference sam- ples and a nominal tip radius, R, of 10 nm for calculation, a calibration plot was con- structed, which could then be used to determine elastic modulus values for the hair samples. All indentation data were individually handled using a Microsoft Excel spreadsheet for curve fi tting, using the Hertz model for a spherical indenter (12), where the applied force, F, and the indentation depth, h, are related to the reduced modulus, E*, by * 0.5 4 = 3 ¸ ¸ ¸ E R h1.5 F (1) Values of the Young’s modulus, E, were obtained from E* by evaluation with the Pois- son’s ratios, as per equation (2) (13). 2 sample tip * sample tip 1– 1– 1 = + O O2 E E E (2) For soft sample s, where Esample is considerably lower than Etip, the second term in equa- tion (2) can be ignored. A value of 0.5 for the Poisson’s ratio was assumed for hair, in line with previously reported measurements on wool (14). THE MODEL A simple but widely used model, the 2-phase model, regards the cortex of hair as a com- posite material consisting of rods (the KIF) arranged parallel to the growing axis of the fi ber and contained in a less ordered matrix (15). This model allows for describing the Young’s moduli acquired along axial and transverse axes, respectively, by the “rule of mixtures” for composites (16,17). The orientations of the nanoindentation measurements are illustrated in Figure 1, for (a) cross sections, and (b) for longitudinal sections. Table I Polymers Used for Calibration (BASF SE, Ludw igshafen, Germany) Polymer Young’s modulus, GPa Poisson’s ratio, ν Low density polyethylene 0.2 0.43 High density polyethylene 1.3 0.46 Polypropylene 1.45 0.40 Polycarbonate 2.4 0.37 Polymethyl methacrylate 3.2 0.375
Purchased for the exclusive use of nofirst nolast (unknown)
From: SCC Media Library & Resource Center (library.scconline.org)