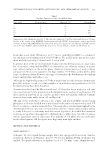
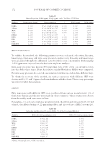
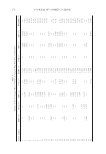
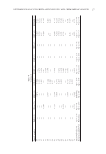
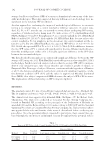
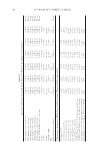
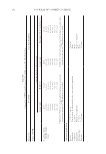
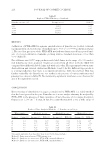
Sample number PABA (%) 3-Benz (%) MBC (%) OCT (%) EHMC (%) HMS (%) EHS (%) EHT (%) BMDBM (%) 33 — — 0.452 0.334 — — — 0.218 0.611 34 — — — 0.449 0.250 — — 0.296 0.656 35 — — — 0.439 0.626 — — 0.09 0.532 36 — 0.989 — — 0.07 — — 0.498 0.524 37 — — — — 0.543 — — — — 38 — — 0.335 0.524 0.698 — — — 0.436 39 — — — 0.480 — — — 8.3 0.685 40 — — — 2.37 — — — — — 41 — 0.720 0.290 — 0.900 — — 0.140 0.574 42 — — 0.449 0.331 — — — 0.202 0.624 43 — — — 0.453 0.251 — — 0.302 0.664 44 — — — 0.441 0.618 — — 0.091 0.528 45 — 1.001 — — 0.081 — — 0.501 0.517 46 — — — — 0.527 — — — — 47 — — 0.333 0.517 0.701 — — — 0.441 48 — — — 0.501 — — — 8.26 0.669 49 — — — 2.290 — — — — — 50 — 0.731 0.301 — 0.090 — — 0.151 0.571 FDA standards [30] Up to 15% Up to 6% Forbidden Up to 10% Up to 7.5% Up to 15% Up to 5% Up to 5% Up to 3% European standard [31] Forbidden Up to 10% Up to 4% Up to 10% Up to 10% Up to 10% Up to 5% Up to 5% Up to 5% Table V Continued DETERMINATION OF SUNSCREEN AGENTS BY HPLC AND CHEMOMETRIC ANALYSIS 175

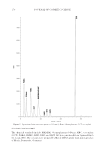
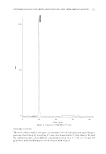
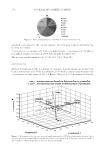
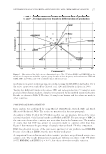
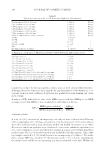
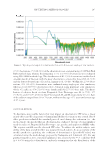
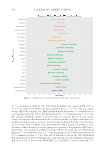
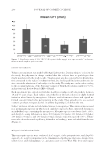
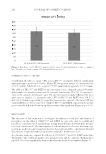
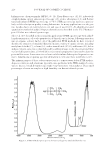
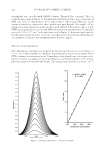
JOURNAL OF COSMETIC SCIENCE 176 standards were spiked to the selected samples. The following formula determines the recovery percentage: % recovery = [(concent ration of UV fi lter in spiked cream - concentration of UV fi lter in non-spiked cream)/concentration of UV fi lter in spiked cream] × 100. The recovery was determin ed to be 97.681–103.778% (Table IV). SAMPLE ANALYSIS Method deve lopment for the determination of sunscreen agents in sun care products has been a controversial issue. Peruchi and Rath (27) worked to separate and determine the concentration of eight agents in 2011 in Brazil. Chang et al. (26) determined 14 widely Figure 3. Pie chart dis p laying the contribution of each value to the total. Figure 4. Illustration o f the objects (sunscreen brand) and variables (UV-fi lter components) in biplot. Circle and plus symbol show two different production dates for the Iranian brand. Triangle and star are used for demonstration of different production dates for the foreign brands.
Purchased for the exclusive use of nofirst nolast (unknown)
From: SCC Media Library & Resource Center (library.scconline.org)